| Red | Green | Blue | |
| z | 17.64 | ||
| znorm | Inf | ||
| sky | -Inf | -Inf | -Inf |
| S/N | 29.8 | 50.3 | 53.5 |
| S/N(c) | 0.0 | 0.0 | 0.0 |
| SN(E/C) |
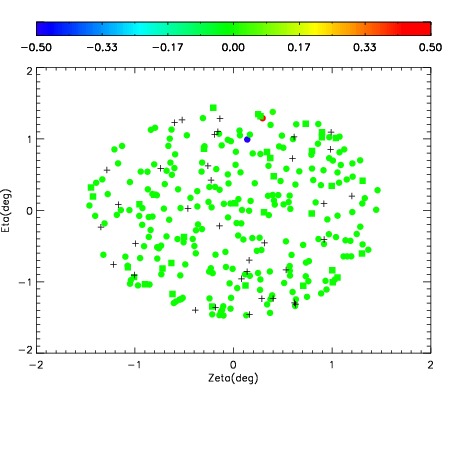
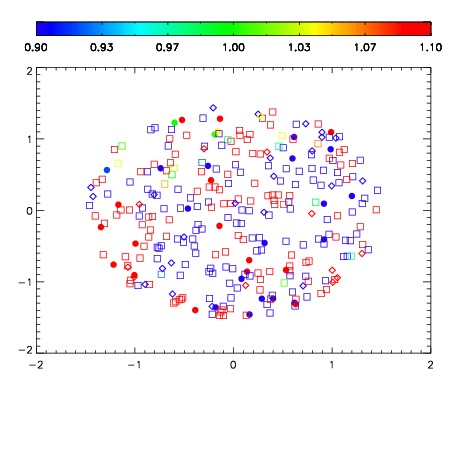
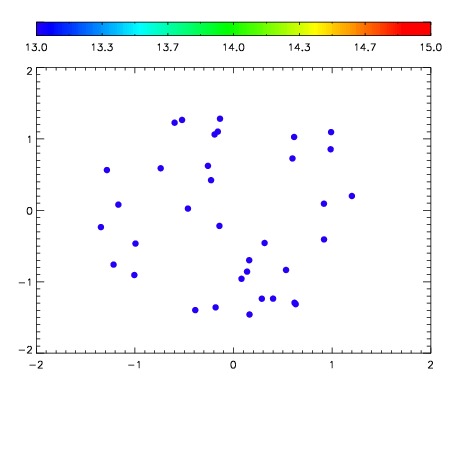

| Frame | Nreads | Zeropoints | Mag plots | Spatial mag deviation | Spatial sky 16325A emission deviations (filled: sky, open: star) | Spatial sky continuum emission | Spatial sky telluric CO2 absorption deviations (filled: H < 10) | |||||||||||||||||||||||
| 0 | 0 |
|
|
|
|
|
|
| IPAIR | NAME | SHIFT | NEWSHIFT | S/N | NAME | SHIFT | NEWSHIFT | S/N |
| 0 | 06970013 | 0.484139 | 0.00000 | 234.634 | 06970018 | -0.00216091 | 0.486300 | 238.483 |
| 1 | 06970017 | 0.482364 | 0.00177500 | 241.919 | 06970015 | -0.00296031 | 0.487099 | 240.833 |
| 2 | 06970016 | 0.482370 | 0.00176901 | 240.685 | 06970014 | -0.00258615 | 0.486725 | 240.003 |
| 3 | 06970012 | 0.483732 | 0.000406981 | 239.154 | 06970011 | 0.00000 | 0.484139 | 239.132 |