| Red | Green | Blue | |
| z | 17.64 | ||
| znorm | Inf | ||
| sky | -Inf | -Inf | -Inf |
| S/N | 28.0 | 46.7 | 53.4 |
| S/N(c) | 0.0 | 0.0 | 0.0 |
| SN(E/C) |
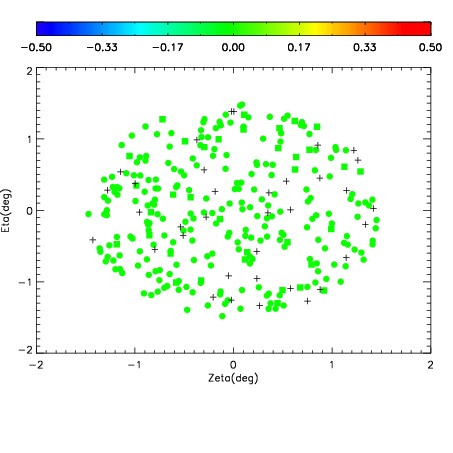
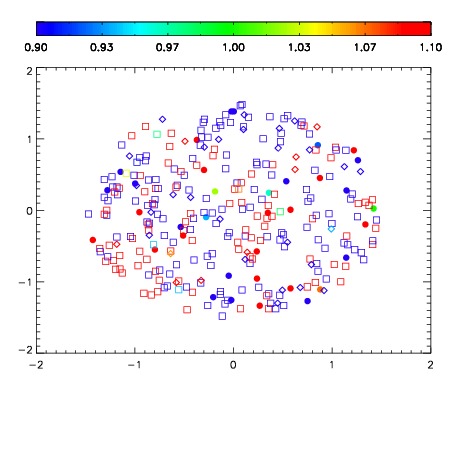


| Frame | Nreads | Zeropoints | Mag plots | Spatial mag deviation | Spatial sky 16325A emission deviations (filled: sky, open: star) | Spatial sky continuum emission | Spatial sky telluric CO2 absorption deviations (filled: H < 10) | |||||||||||||||||||||||
| 0 | 0 |
|
|
|
|
|
|
| IPAIR | NAME | SHIFT | NEWSHIFT | S/N | NAME | SHIFT | NEWSHIFT | S/N |
| 0 | 06640031 | 0.485132 | 0.00000 | 224.509 | 06640025 | 0.00000 | 0.485132 | 226.555 |
| 1 | 06640026 | 0.482291 | 0.00284100 | 227.497 | 06640028 | 0.000912354 | 0.484220 | 231.775 |
| 2 | 06640027 | 0.482467 | 0.00266501 | 224.741 | 06640029 | -0.000802021 | 0.485934 | 227.076 |
| 3 | 06640030 | 0.484731 | 0.000401020 | 221.669 | 06640032 | -0.00105359 | 0.486186 | 223.903 |