| Red | Green | Blue | |
| z | 17.64 | ||
| znorm | Inf | ||
| sky | -Inf | -Inf | -Inf |
| S/N | 28.6 | 47.6 | 51.8 |
| S/N(c) | 0.0 | 0.0 | 0.0 |
| SN(E/C) |

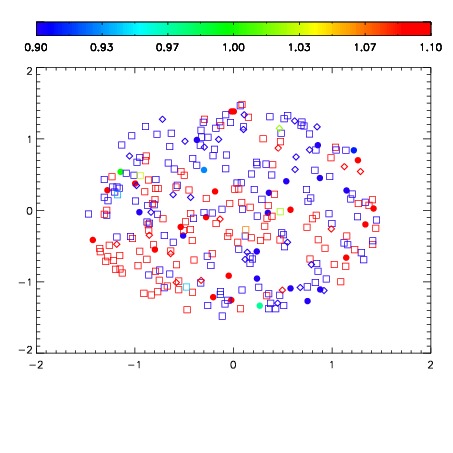
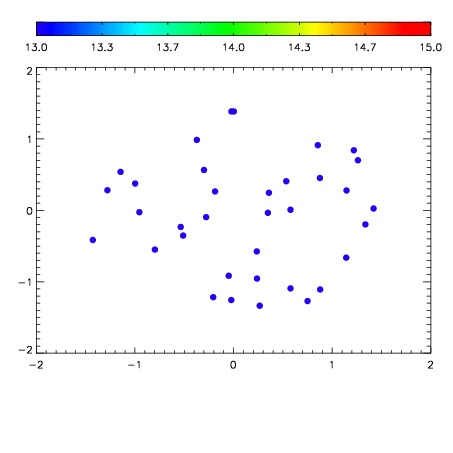

| Frame | Nreads | Zeropoints | Mag plots | Spatial mag deviation | Spatial sky 16325A emission deviations (filled: sky, open: star) | Spatial sky continuum emission | Spatial sky telluric CO2 absorption deviations (filled: H < 10) | |||||||||||||||||||||||
| 0 | 0 |
|
|
|
|
|
|
| IPAIR | NAME | SHIFT | NEWSHIFT | S/N | NAME | SHIFT | NEWSHIFT | S/N |
| 0 | 06940013 | 0.498331 | 0.00000 | 236.861 | 06940011 | 0.00000 | 0.498331 | 239.443 |
| 1 | 06940016 | 0.496826 | 0.00150502 | 249.317 | 06940015 | -0.000378664 | 0.498710 | 246.658 |
| 2 | 06940017 | 0.497320 | 0.00101101 | 246.831 | 06940014 | 0.000864000 | 0.497467 | 242.098 |
| 3 | 06940012 | 0.498280 | 5.10216e-05 | 235.326 | 06940018 | 0.000538341 | 0.497793 | 238.125 |