| Red | Green | Blue | |
| z | 17.64 | ||
| znorm | Inf | ||
| sky | -Inf | -Inf | -Inf |
| S/N | 18.0 | 32.0 | 36.2 |
| S/N(c) | 0.0 | 0.0 | 0.0 |
| SN(E/C) |
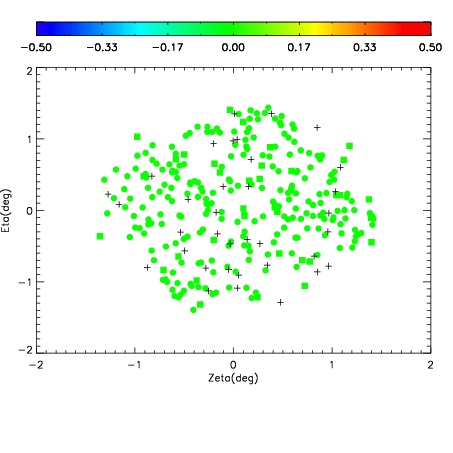
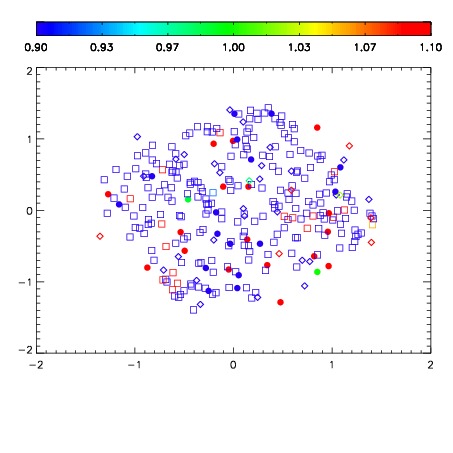
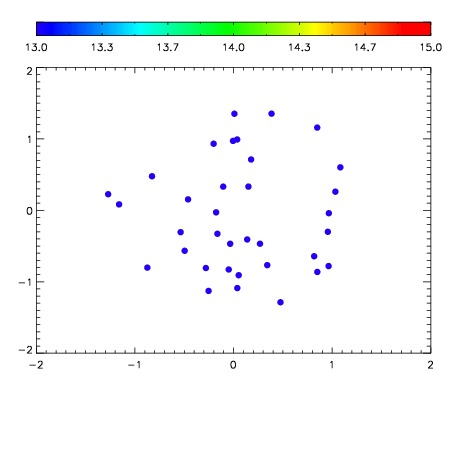

| Frame | Nreads | Zeropoints | Mag plots | Spatial mag deviation | Spatial sky 16325A emission deviations (filled: sky, open: star) | Spatial sky continuum emission | Spatial sky telluric CO2 absorption deviations (filled: H < 10) | |||||||||||||||||||||||
| 0 | 0 |
|
|
|
|
|
|
| IPAIR | NAME | SHIFT | NEWSHIFT | S/N | NAME | SHIFT | NEWSHIFT | S/N |
| 0 | 08030013 | 0.523793 | 0.00000 | 212.565 | 08030014 | -0.00284864 | 0.526642 | 216.184 |
| 1 | 08030012 | 0.523571 | 0.000221968 | 219.238 | 08030011 | 0.00000 | 0.523793 | 221.742 |
| 2 | 08030016 | 0.519237 | 0.00455600 | 202.946 | 08030015 | -0.00394748 | 0.527740 | 212.002 |