| Red | Green | Blue | |
| z | 17.64 | ||
| znorm | Inf | ||
| sky | -Inf | -Inf | -Inf |
| S/N | 20.9 | 36.4 | 41.8 |
| S/N(c) | 0.0 | 0.0 | 0.0 |
| SN(E/C) |
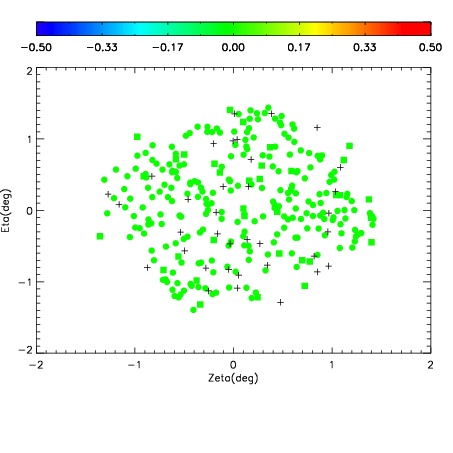
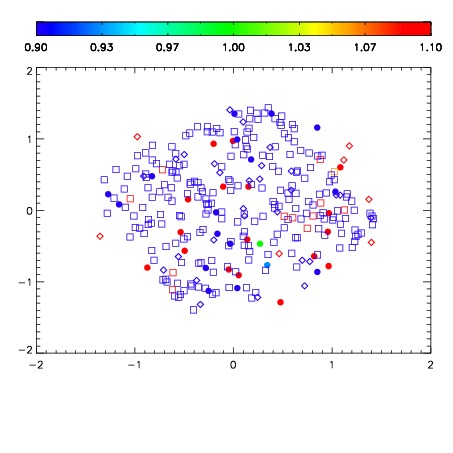
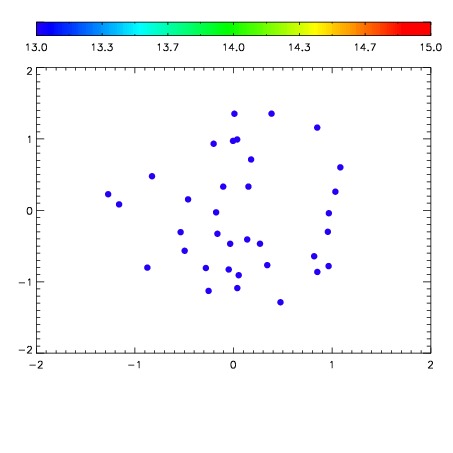

| Frame | Nreads | Zeropoints | Mag plots | Spatial mag deviation | Spatial sky 16325A emission deviations (filled: sky, open: star) | Spatial sky continuum emission | Spatial sky telluric CO2 absorption deviations (filled: H < 10) | |||||||||||||||||||||||
| 0 | 0 |
|
|
|
|
|
|
| IPAIR | NAME | SHIFT | NEWSHIFT | S/N | NAME | SHIFT | NEWSHIFT | S/N |
| 0 | 08040148 | 0.509818 | 0.00000 | 240.762 | 08040146 | 0.00000 | 0.509818 | 233.204 |
| 1 | 08040151 | 0.503494 | 0.00632399 | 242.409 | 08040149 | -0.00348404 | 0.513302 | 242.490 |
| 2 | 08040147 | 0.505678 | 0.00414002 | 240.856 | 08040150 | -0.00514749 | 0.514966 | 241.973 |