| Red | Green | Blue | |
| z | 17.64 | ||
| znorm | Inf | ||
| sky | -Inf | -Inf | -Inf |
| S/N | 21.4 | 33.9 | 38.0 |
| S/N(c) | 0.0 | 0.0 | 0.0 |
| SN(E/C) |
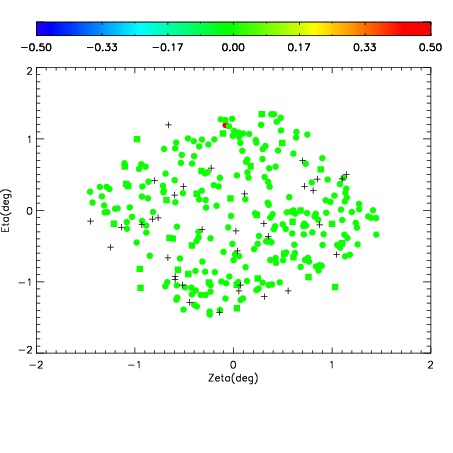
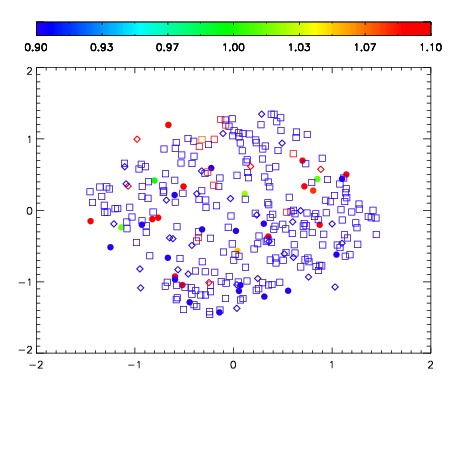
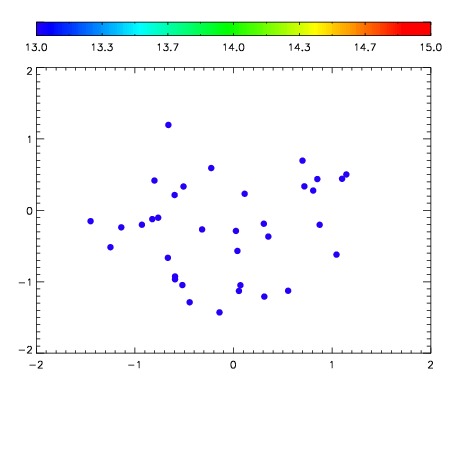

| Frame | Nreads | Zeropoints | Mag plots | Spatial mag deviation | Spatial sky 16325A emission deviations (filled: sky, open: star) | Spatial sky continuum emission | Spatial sky telluric CO2 absorption deviations (filled: H < 10) | |||||||||||||||||||||||
| 0 | 0 |
|
|
|
|
|
|
| IPAIR | NAME | SHIFT | NEWSHIFT | S/N | NAME | SHIFT | NEWSHIFT | S/N |
| 0 | 08060015 | 0.509776 | 0.00000 | 233.779 | 08060017 | -0.00536888 | 0.515145 | 235.028 |
| 1 | 08060014 | 0.504002 | 0.00577402 | 240.620 | 08060016 | -0.00473007 | 0.514506 | 239.228 |
| 2 | 08060018 | 0.507672 | 0.00210398 | 224.802 | 08060013 | 0.00000 | 0.509776 | 228.595 |