| Red | Green | Blue | |
| z | 17.64 | ||
| znorm | Inf | ||
| sky | -Inf | -NaN | -Inf |
| S/N | 27.6 | 43.2 | 49.9 |
| S/N(c) | 0.0 | 0.0 | 0.0 |
| SN(E/C) |
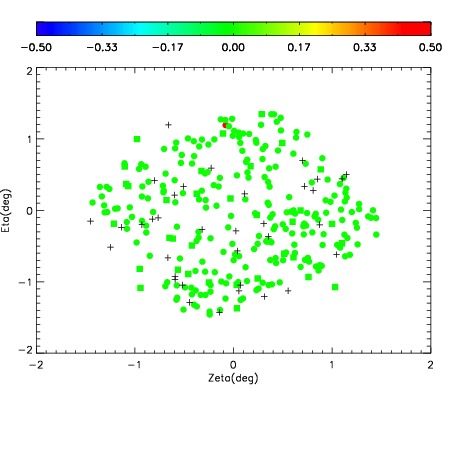
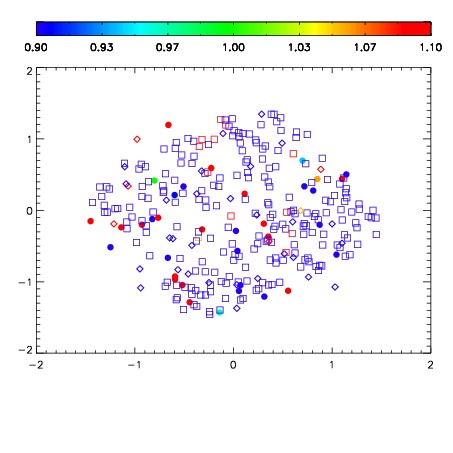
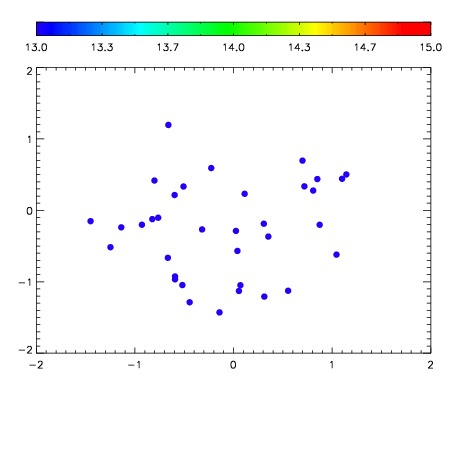

| Frame | Nreads | Zeropoints | Mag plots | Spatial mag deviation | Spatial sky 16325A emission deviations (filled: sky, open: star) | Spatial sky continuum emission | Spatial sky telluric CO2 absorption deviations (filled: H < 10) | |||||||||||||||||||||||
| 0 | 0 |
|
|
|
|
|
|
| IPAIR | NAME | SHIFT | NEWSHIFT | S/N | NAME | SHIFT | NEWSHIFT | S/N |
| 0 | 08490050 | 0.480047 | 0.00000 | 224.240 | 08490051 | 0.00276530 | 0.477282 | 227.524 |
| 1 | 08490049 | 0.479983 | 6.39856e-05 | 231.908 | 08490048 | 0.00000 | 0.480047 | 235.087 |
| 2 | 08490054 | 0.477023 | 0.00302398 | 229.219 | 08490052 | 0.00125021 | 0.478797 | 233.294 |
| 3 | 08490053 | 0.476642 | 0.00340497 | 227.808 | 08490055 | -1.87734e-05 | 0.480066 | 231.485 |