| Red | Green | Blue | |
| z | 17.64 | ||
| znorm | Inf | ||
| sky | -Inf | -Inf | -Inf |
| S/N | 29.5 | 47.1 | 53.2 |
| S/N(c) | 0.0 | 0.0 | 0.0 |
| SN(E/C) |
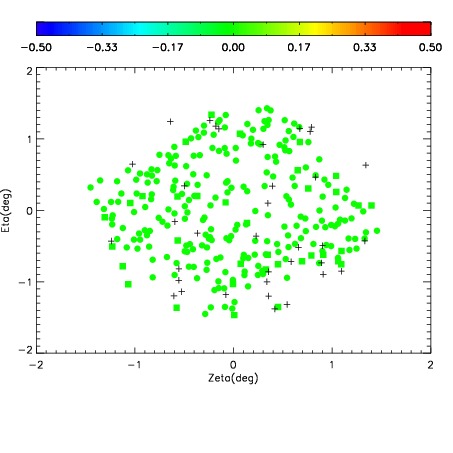
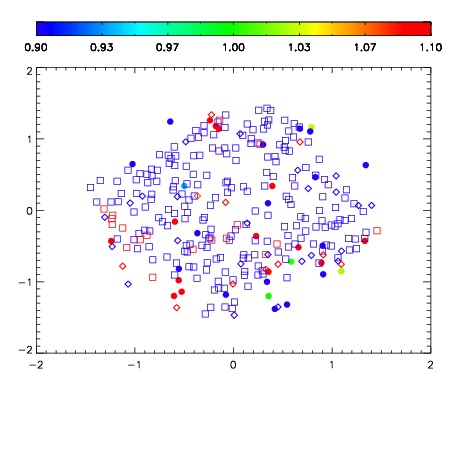
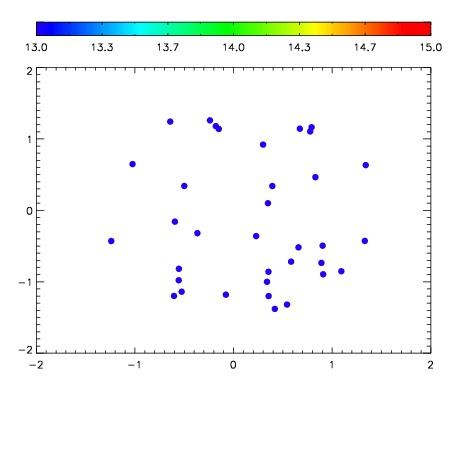

| Frame | Nreads | Zeropoints | Mag plots | Spatial mag deviation | Spatial sky 16325A emission deviations (filled: sky, open: star) | Spatial sky continuum emission | Spatial sky telluric CO2 absorption deviations (filled: H < 10) | |||||||||||||||||||||||
| 0 | 0 |
|
|
|
|
|
|
| IPAIR | NAME | SHIFT | NEWSHIFT | S/N | NAME | SHIFT | NEWSHIFT | S/N |
| 0 | 08760053 | 0.468261 | 0.00000 | 162.364 | 08760048 | 0.00000 | 0.468261 | 164.225 |
| 1 | 08760057 | 0.465870 | 0.00239101 | 174.689 | 08760055 | -0.00246973 | 0.470731 | 179.259 |
| 2 | 08760058 | 0.467433 | 0.000827998 | 173.223 | 08760059 | -0.00127325 | 0.469534 | 177.513 |
| 3 | 08760054 | 0.467723 | 0.000537992 | 171.935 | 08760052 | 0.000142293 | 0.468119 | 175.491 |
| 4 | 08760049 | 0.465517 | 0.00274399 | 170.591 | 08760051 | -0.00126175 | 0.469523 | 174.342 |
| 5 | 08760050 | 0.466753 | 0.00150800 | 167.837 | 08760056 | -0.00165219 | 0.469913 | 173.419 |