| Red | Green | Blue | |
| z | 17.64 | ||
| znorm | Inf | ||
| sky | -Inf | -Inf | -Inf |
| S/N | 22.8 | 35.2 | 41.1 |
| S/N(c) | 0.0 | 0.0 | 0.0 |
| SN(E/C) |

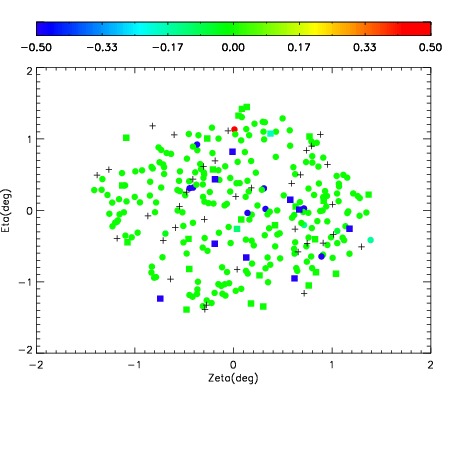
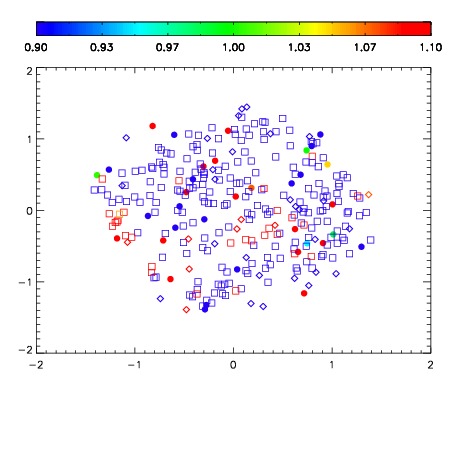
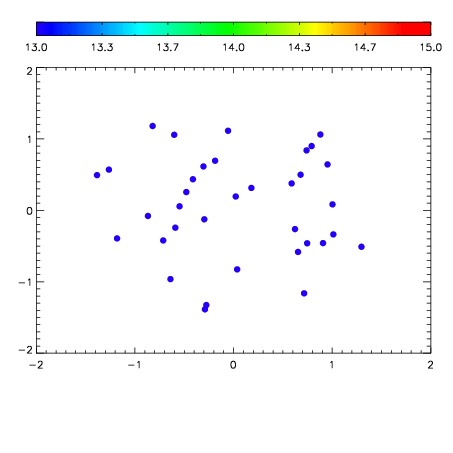

| Frame | Nreads | Zeropoints | Mag plots | Spatial mag deviation | Spatial sky 16325A emission deviations (filled: sky, open: star) | Spatial sky continuum emission | Spatial sky telluric CO2 absorption deviations (filled: H < 10) | |||||||||||||||||||||||
| 0 | 0 |
|
|
|
|
|
|
| IPAIR | NAME | SHIFT | NEWSHIFT | S/N | NAME | SHIFT | NEWSHIFT | S/N |
| 0 | 08760083 | 0.473504 | 0.00000 | 185.271 | 08760082 | -0.00367631 | 0.477180 | 183.979 |
| 1 | 08760079 | 0.472523 | 0.000981003 | 179.676 | 08760081 | -0.00301968 | 0.476524 | 183.415 |
| 2 | 08760080 | 0.472232 | 0.00127199 | 174.299 | 08760078 | -0.000698558 | 0.474203 | 181.651 |
| 3 | 08760075 | 0.382707 | 0.0907970 | -5.55742e-09 | 08760077 | -0.000151133 | 0.473655 | 169.771 |
| 4 | 08760076 | 0.429515 | 0.0439890 | -6.41689e-09 | 08760074 | 0.00000 | 0.473504 | 161.298 |