| Red | Green | Blue | |
| z | 17.64 | ||
| znorm | Inf | ||
| sky | -Inf | -Inf | -Inf |
| S/N | 21.3 | 33.0 | 41.0 |
| S/N(c) | 0.0 | 0.0 | 0.0 |
| SN(E/C) |
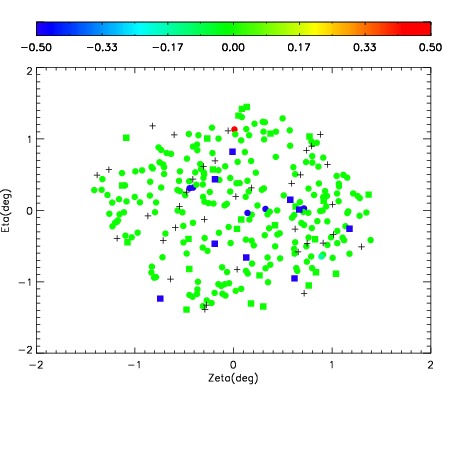
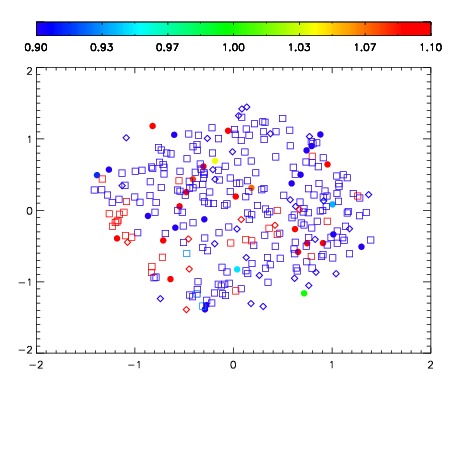
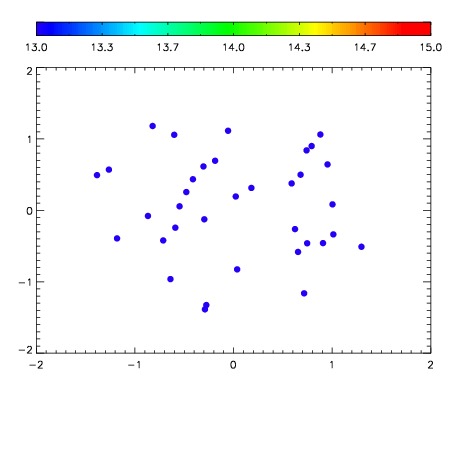

| Frame | Nreads | Zeropoints | Mag plots | Spatial mag deviation | Spatial sky 16325A emission deviations (filled: sky, open: star) | Spatial sky continuum emission | Spatial sky telluric CO2 absorption deviations (filled: H < 10) | |||||||||||||||||||||||
| 0 | 0 |
|
|
|
|
|
|
| IPAIR | NAME | SHIFT | NEWSHIFT | S/N | NAME | SHIFT | NEWSHIFT | S/N |
| 0 | 08770075 | 0.476778 | 0.00000 | 173.331 | 08770069 | 0.00000 | 0.476778 | 178.308 |
| 1 | 08770070 | 0.474303 | 0.00247499 | 182.235 | 08770073 | 0.00138611 | 0.475392 | 182.194 |
| 2 | 08770074 | 0.474705 | 0.00207299 | 179.448 | 08770072 | 0.00148569 | 0.475292 | 179.167 |
| 3 | 08770071 | 0.361869 | 0.114909 | -6.20230e-09 | 08770076 | 0.00207310 | 0.474705 | 177.195 |