| Red | Green | Blue | |
| z | 17.64 | ||
| znorm | Inf | ||
| sky | -Inf | -NaN | -Inf |
| S/N | 25.7 | 42.4 | 43.2 |
| S/N(c) | 0.0 | 0.0 | 0.0 |
| SN(E/C) |
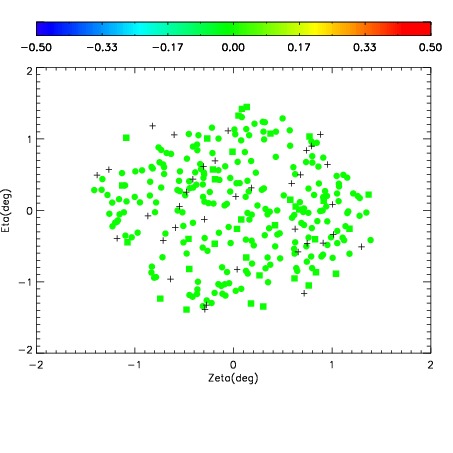
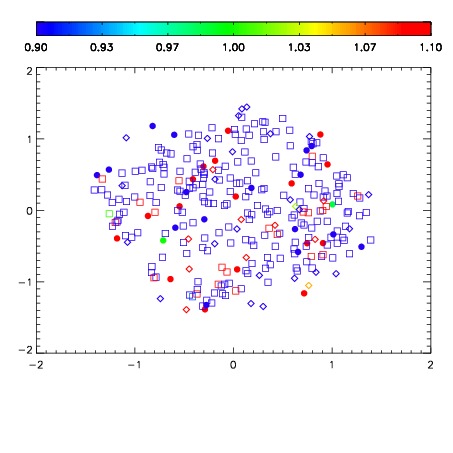
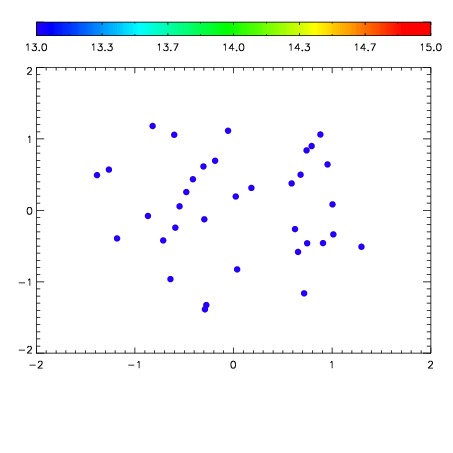

| Frame | Nreads | Zeropoints | Mag plots | Spatial mag deviation | Spatial sky 16325A emission deviations (filled: sky, open: star) | Spatial sky continuum emission | Spatial sky telluric CO2 absorption deviations (filled: H < 10) | |||||||||||||||||||||||
| 0 | 0 |
|
|
|
|
|
|
| IPAIR | NAME | SHIFT | NEWSHIFT | S/N | NAME | SHIFT | NEWSHIFT | S/N |
| 0 | 08800026 | 0.472915 | 0.00000 | 190.866 | 08800028 | -0.00228829 | 0.475203 | 190.375 |
| 1 | 08800030 | 0.470311 | 0.00260401 | 198.921 | 08800031 | -0.00331135 | 0.476226 | 204.786 |
| 2 | 08800029 | 0.470363 | 0.00255200 | 193.478 | 08800027 | -0.00323744 | 0.476152 | 190.836 |
| 3 | 08800025 | 0.471449 | 0.00146601 | 184.622 | 08800024 | 0.00000 | 0.472915 | 183.542 |