| Red | Green | Blue | |
| z | 17.64 | ||
| znorm | Inf | ||
| sky | -Inf | -Inf | -Inf |
| S/N | 28.4 | 49.9 | 53.9 |
| S/N(c) | 0.0 | 0.0 | 0.0 |
| SN(E/C) |
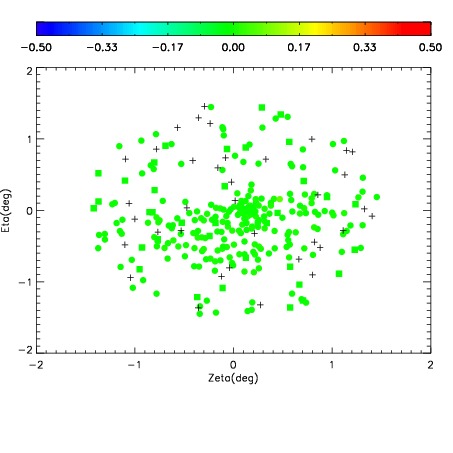
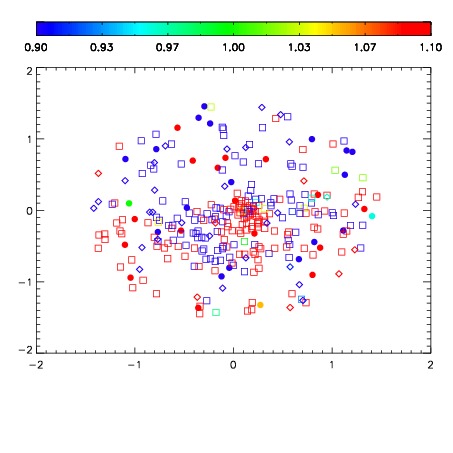
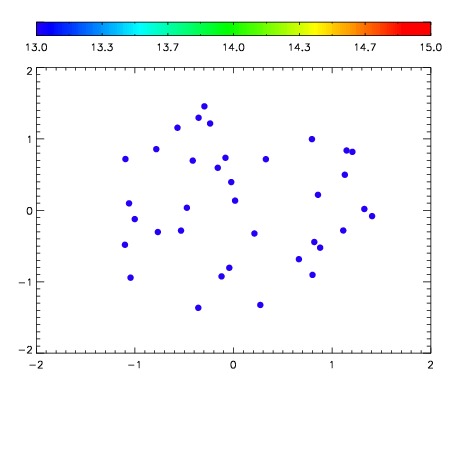

| Frame | Nreads | Zeropoints | Mag plots | Spatial mag deviation | Spatial sky 16325A emission deviations (filled: sky, open: star) | Spatial sky continuum emission | Spatial sky telluric CO2 absorption deviations (filled: H < 10) | |||||||||||||||||||||||
| 0 | 0 |
|
|
|
|
|
|
| IPAIR | NAME | SHIFT | NEWSHIFT | S/N | NAME | SHIFT | NEWSHIFT | S/N |
| 0 | 06060038 | 0.490536 | 0.00000 | 197.601 | 06060043 | -0.00270755 | 0.493244 | 197.929 |
| 1 | 06060037 | 0.489549 | 0.000986993 | 210.076 | 06060036 | 0.00000 | 0.490536 | 212.954 |
| 2 | 06060041 | 0.488778 | 0.00175801 | 205.383 | 06060039 | 0.000177019 | 0.490359 | 203.853 |
| 3 | 06060042 | 0.489953 | 0.000582993 | 200.230 | 06060040 | -0.00117848 | 0.491714 | 201.753 |