| Red | Green | Blue | |
| z | 17.64 | ||
| znorm | Inf | ||
| sky | -Inf | -Inf | -Inf |
| S/N | 30.3 | 52.7 | 58.5 |
| S/N(c) | 0.0 | 0.0 | 0.0 |
| SN(E/C) |

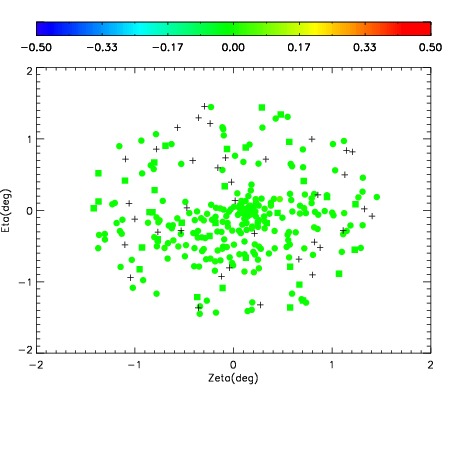
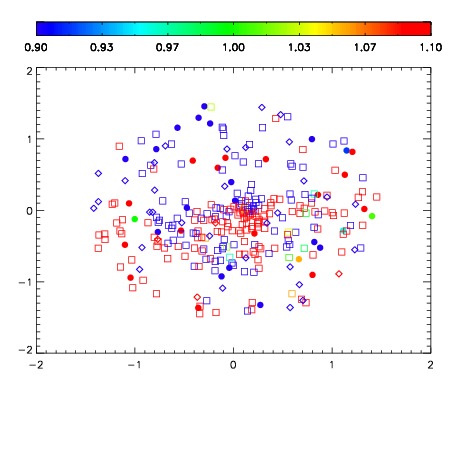


| Frame | Nreads | Zeropoints | Mag plots | Spatial mag deviation | Spatial sky 16325A emission deviations (filled: sky, open: star) | Spatial sky continuum emission | Spatial sky telluric CO2 absorption deviations (filled: H < 10) | |||||||||||||||||||||||
| 0 | 0 |
|
|
|
|
|
|
| IPAIR | NAME | SHIFT | NEWSHIFT | S/N | NAME | SHIFT | NEWSHIFT | S/N |
| 0 | 06100049 | 0.493638 | 0.00000 | 213.264 | 06100050 | 0.00262424 | 0.491014 | 210.590 |
| 1 | 06100048 | 0.492936 | 0.000702024 | 213.761 | 06100047 | 0.00000 | 0.493638 | 211.892 |
| 2 | 06100052 | 0.491432 | 0.00220600 | 207.456 | 06100051 | 0.00166598 | 0.491972 | 207.861 |
| 3 | 06100053 | 0.491820 | 0.00181800 | 203.965 | 06100054 | 0.00336432 | 0.490274 | 207.005 |