| Red | Green | Blue | |
| z | 17.64 | ||
| znorm | Inf | ||
| sky | -Inf | -Inf | -Inf |
| S/N | 25.4 | 45.4 | 49.8 |
| S/N(c) | 0.0 | 0.0 | 0.0 |
| SN(E/C) |
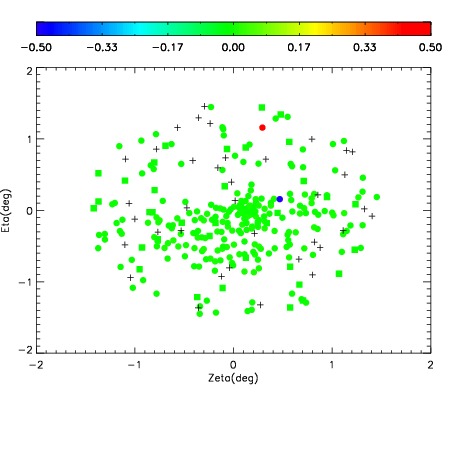
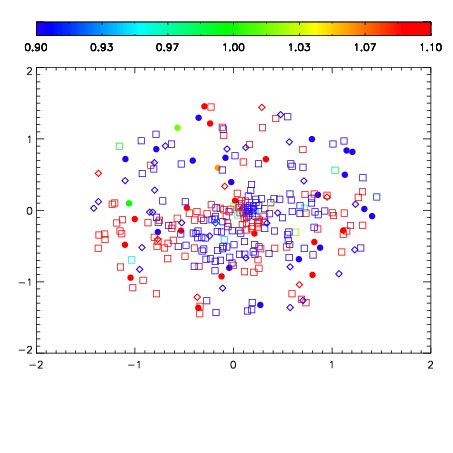
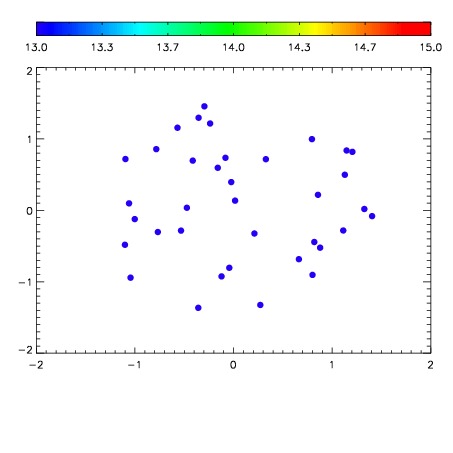

| Frame | Nreads | Zeropoints | Mag plots | Spatial mag deviation | Spatial sky 16325A emission deviations (filled: sky, open: star) | Spatial sky continuum emission | Spatial sky telluric CO2 absorption deviations (filled: H < 10) | |||||||||||||||||||||||
| 0 | 0 |
|
|
|
|
|
|
| IPAIR | NAME | SHIFT | NEWSHIFT | S/N | NAME | SHIFT | NEWSHIFT | S/N |
| 0 | 06320039 | 0.479319 | 0.00000 | 200.562 | 06320040 | 0.00879328 | 0.470526 | 194.134 |
| 1 | 06320038 | 0.478301 | 0.00101802 | 216.327 | 06320037 | 0.00000 | 0.479319 | 207.861 |
| 2 | 06320043 | 0.477470 | 0.00184900 | 185.459 | 06320041 | 0.00341082 | 0.475908 | 183.989 |
| 3 | 06320042 | 0.477301 | 0.00201800 | 182.221 | 06320044 | 0.00531981 | 0.473999 | 178.639 |