| Red | Green | Blue | |
| z | 17.64 | ||
| znorm | Inf | ||
| sky | -Inf | -Inf | -Inf |
| S/N | 22.2 | 41.4 | 42.6 |
| S/N(c) | 0.0 | 0.0 | 0.0 |
| SN(E/C) |
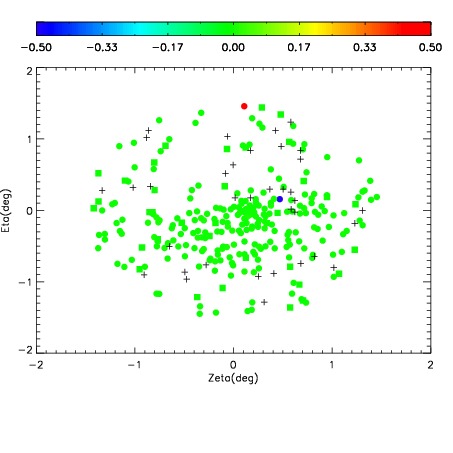
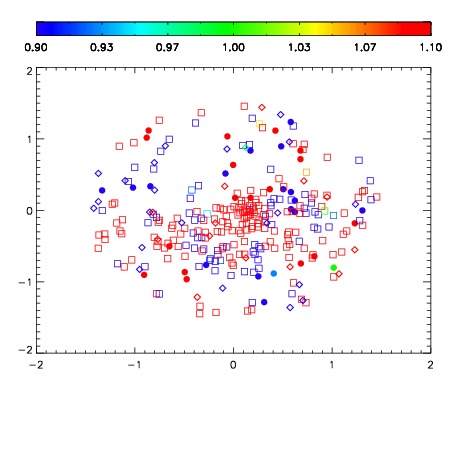
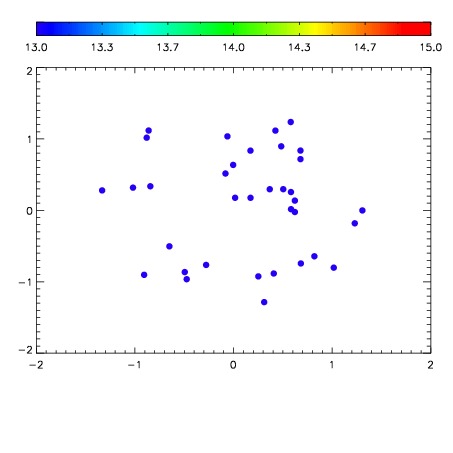

| Frame | Nreads | Zeropoints | Mag plots | Spatial mag deviation | Spatial sky 16325A emission deviations (filled: sky, open: star) | Spatial sky continuum emission | Spatial sky telluric CO2 absorption deviations (filled: H < 10) | |||||||||||||||||||||||
| 0 | 0 |
|
|
|
|
|
|
| IPAIR | NAME | SHIFT | NEWSHIFT | S/N | NAME | SHIFT | NEWSHIFT | S/N |
| 0 | 06070049 | 0.477941 | 0.00000 | 172.395 | 06070050 | 0.00155014 | 0.476391 | 170.161 |
| 1 | 06070053 | 0.477366 | 0.000575006 | 184.446 | 06070054 | -0.000768439 | 0.478709 | 188.552 |
| 2 | 06070052 | 0.477028 | 0.000912994 | 179.622 | 06070051 | -7.22319e-05 | 0.478013 | 173.198 |
| 3 | 06070048 | 0.477673 | 0.000268012 | 166.315 | 06070047 | 0.00000 | 0.477941 | 167.605 |