| Red | Green | Blue | |
| z | 17.64 | ||
| znorm | Inf | ||
| sky | -Inf | -NaN | -Inf |
| S/N | 25.8 | 47.3 | 49.1 |
| S/N(c) | 0.0 | 0.0 | 0.0 |
| SN(E/C) |
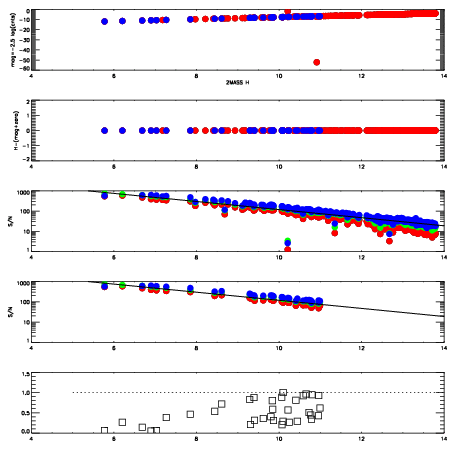
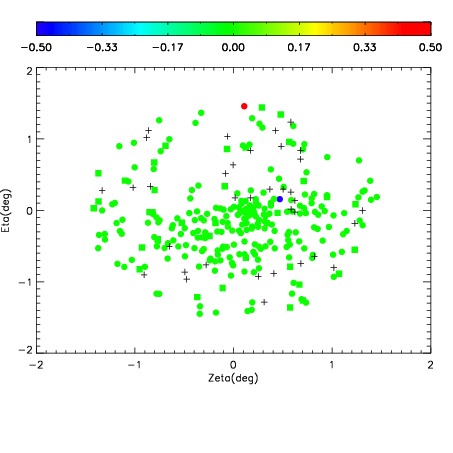
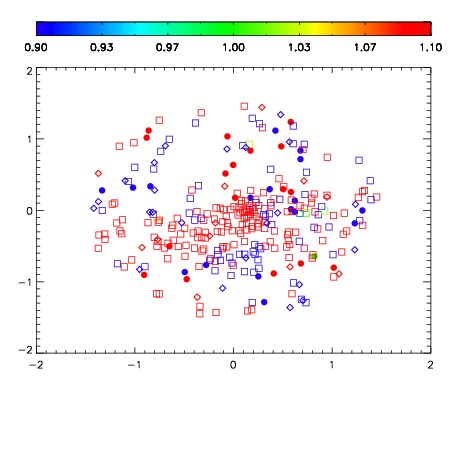
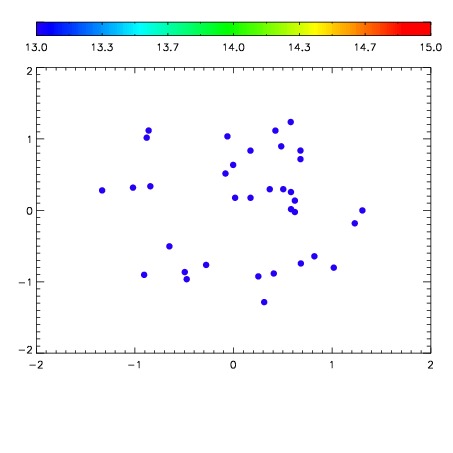

| Frame | Nreads | Zeropoints | Mag plots | Spatial mag deviation | Spatial sky 16325A emission deviations (filled: sky, open: star) | Spatial sky continuum emission | Spatial sky telluric CO2 absorption deviations (filled: H < 10) | |||||||||||||||||||||||
| 0 | 0 |
|
|
|
|
|
|
| IPAIR | NAME | SHIFT | NEWSHIFT | S/N | NAME | SHIFT | NEWSHIFT | S/N |
| 0 | 06330041 | 0.478680 | 0.00000 | 192.449 | 06330042 | 0.000966052 | 0.477714 | 195.614 |
| 1 | 06330040 | 0.478186 | 0.000494003 | 194.112 | 06330039 | 0.00807920 | 0.470601 | 195.840 |
| 2 | 06330036 | 0.473467 | 0.00521302 | 191.703 | 06330038 | 0.00510462 | 0.473575 | 191.935 |
| 3 | 06330037 | 0.473300 | 0.00538000 | 183.850 | 06330035 | 0.00000 | 0.478680 | 186.808 |