| Red | Green | Blue | |
| z | 17.64 | ||
| znorm | Inf | ||
| sky | -Inf | -Inf | -Inf |
| S/N | 34.2 | 57.6 | 62.7 |
| S/N(c) | 0.0 | 0.0 | 0.0 |
| SN(E/C) |
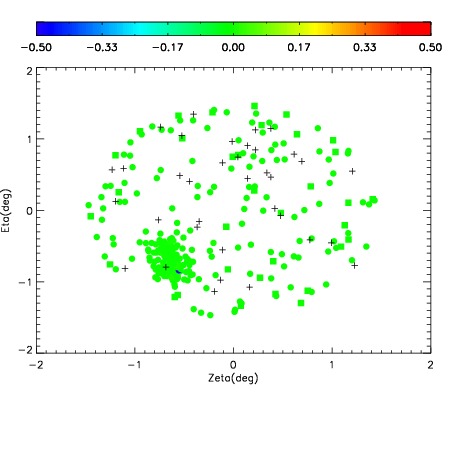


| Frame | Nreads | Zeropoints | Mag plots | Spatial mag deviation | Spatial sky 16325A emission deviations (filled: sky, open: star) | Spatial sky continuum emission | Spatial sky telluric CO2 absorption deviations (filled: H < 10) | |||||||||||||||||||||||
| 0 | 0 |
|
|
|
|
|
|
| IPAIR | NAME | SHIFT | NEWSHIFT | S/N | NAME | SHIFT | NEWSHIFT | S/N |
| 0 | 06680097 | 0.488607 | 0.00000 | 243.964 | 06680098 | 0.00133888 | 0.487268 | 246.511 |
| 1 | 06680096 | 0.488461 | 0.000146002 | 243.099 | 06680094 | 0.000796204 | 0.487811 | 244.682 |
| 2 | 06680093 | 0.488149 | 0.000458002 | 243.037 | 06680095 | 3.49061e-05 | 0.488572 | 243.668 |
| 3 | 06680088 | 0.487947 | 0.000660002 | 238.773 | 06680090 | 0.00161961 | 0.486987 | 239.233 |
| 4 | 06680092 | 0.486636 | 0.00197098 | 237.977 | 06680087 | 0.00000 | 0.488607 | 236.159 |
| 5 | 06680089 | 0.487830 | 0.000776976 | 236.753 | 06680091 | -0.000700317 | 0.489307 | 234.142 |