| Red | Green | Blue | |
| z | 17.64 | ||
| znorm | Inf | ||
| sky | -Inf | -Inf | -Inf |
| S/N | 27.4 | 46.4 | 51.6 |
| S/N(c) | 0.0 | 0.0 | 0.0 |
| SN(E/C) |
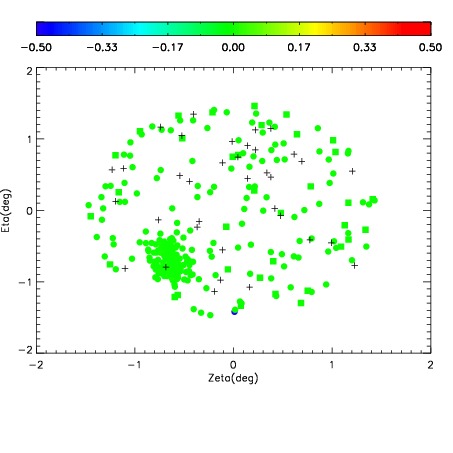
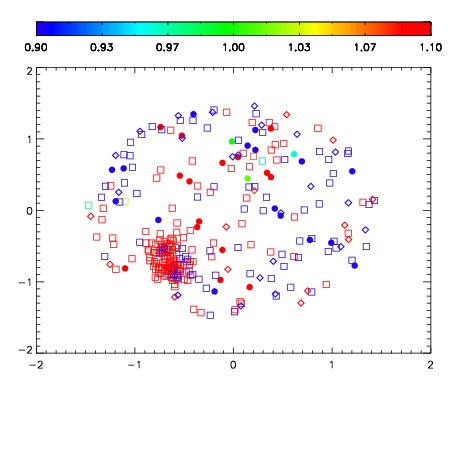
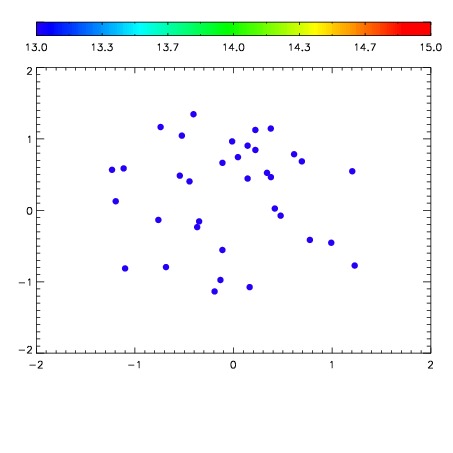

| Frame | Nreads | Zeropoints | Mag plots | Spatial mag deviation | Spatial sky 16325A emission deviations (filled: sky, open: star) | Spatial sky continuum emission | Spatial sky telluric CO2 absorption deviations (filled: H < 10) | |||||||||||||||||||||||
| 0 | 0 |
|
|
|
|
|
|
| IPAIR | NAME | SHIFT | NEWSHIFT | S/N | NAME | SHIFT | NEWSHIFT | S/N |
| 0 | 06750023 | 0.492565 | 0.00000 | 212.993 | 06750025 | -0.00137577 | 0.493941 | 209.446 |
| 1 | 06750026 | 0.491973 | 0.000591993 | 213.362 | 06750028 | 0.00222501 | 0.490340 | 215.731 |
| 2 | 06750027 | 0.492271 | 0.000294000 | 211.722 | 06750024 | -0.000164570 | 0.492730 | 209.149 |
| 3 | 06750022 | 0.491998 | 0.000567019 | 208.811 | 06750021 | 0.00000 | 0.492565 | 203.086 |