| Red | Green | Blue | |
| z | 17.64 | ||
| znorm | Inf | ||
| sky | -Inf | -Inf | -Inf |
| S/N | 28.8 | 49.0 | 50.9 |
| S/N(c) | 0.0 | 0.0 | 0.0 |
| SN(E/C) |
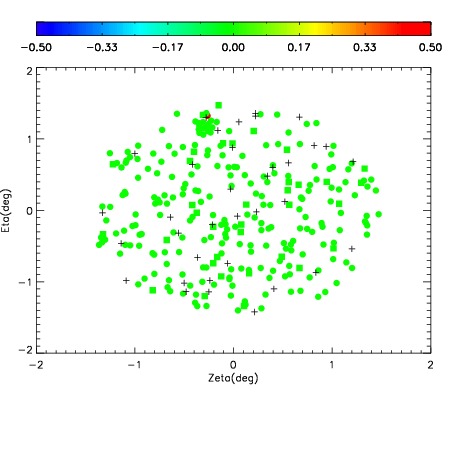
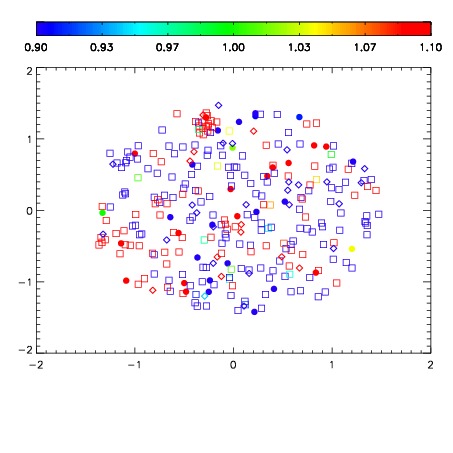
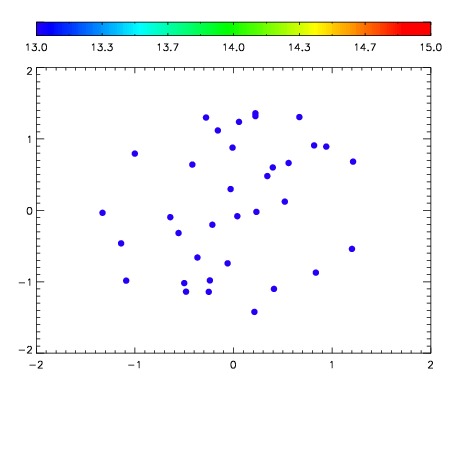

| Frame | Nreads | Zeropoints | Mag plots | Spatial mag deviation | Spatial sky 16325A emission deviations (filled: sky, open: star) | Spatial sky continuum emission | Spatial sky telluric CO2 absorption deviations (filled: H < 10) | |||||||||||||||||||||||
| 0 | 0 |
|
|
|
|
|
|
| IPAIR | NAME | SHIFT | NEWSHIFT | S/N | NAME | SHIFT | NEWSHIFT | S/N |
| 0 | 06660042 | 0.487090 | 0.00000 | 236.525 | 06660040 | -0.00191605 | 0.489006 | 240.026 |
| 1 | 06660041 | 0.485950 | 0.00114000 | 238.374 | 06660043 | 0.00210576 | 0.484984 | 242.597 |
| 2 | 06660037 | 0.485846 | 0.00124398 | 235.952 | 06660039 | -0.00222143 | 0.489311 | 237.049 |
| 3 | 06660038 | 0.485804 | 0.00128600 | 234.874 | 06660036 | 0.00000 | 0.487090 | 234.631 |