| Red | Green | Blue | |
| z | 17.64 | ||
| znorm | Inf | ||
| sky | -Inf | -Inf | -Inf |
| S/N | 24.3 | 41.5 | 44.0 |
| S/N(c) | 0.0 | 0.0 | 0.0 |
| SN(E/C) |
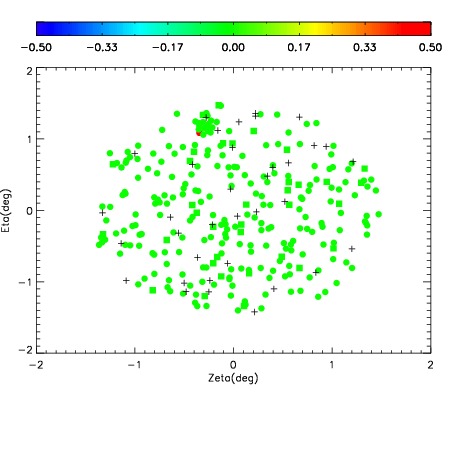
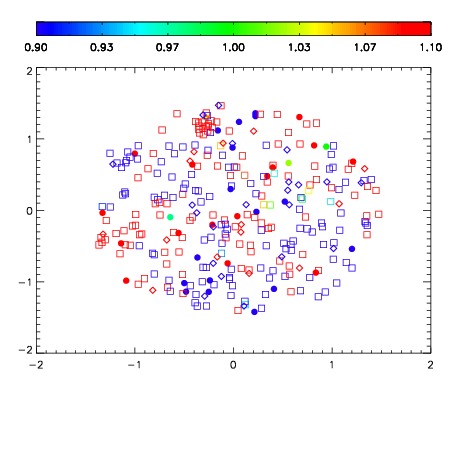
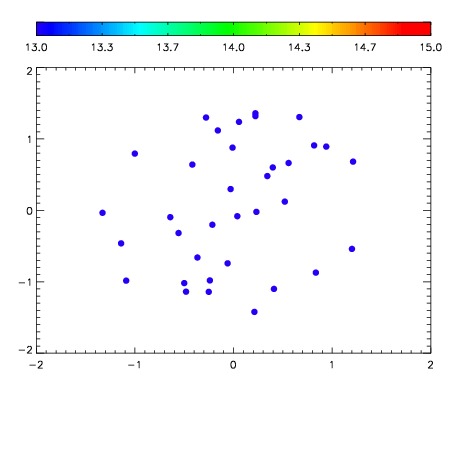

| Frame | Nreads | Zeropoints | Mag plots | Spatial mag deviation | Spatial sky 16325A emission deviations (filled: sky, open: star) | Spatial sky continuum emission | Spatial sky telluric CO2 absorption deviations (filled: H < 10) | |||||||||||||||||||||||
| 0 | 0 |
|
|
|
|
|
|
| IPAIR | NAME | SHIFT | NEWSHIFT | S/N | NAME | SHIFT | NEWSHIFT | S/N |
| 0 | 06890032 | 0.494383 | 0.00000 | 219.733 | 06890033 | 0.00321352 | 0.491169 | 213.208 |
| 1 | 06890027 | 0.493219 | 0.00116402 | 240.710 | 06890029 | 0.000551385 | 0.493832 | 238.942 |
| 2 | 06890028 | 0.494278 | 0.000104994 | 236.553 | 06890030 | -0.00329638 | 0.497679 | 238.595 |
| 3 | 06890031 | 0.494266 | 0.000117004 | 225.790 | 06890026 | 0.00000 | 0.494383 | 226.736 |