| Red | Green | Blue | |
| z | 17.64 | ||
| znorm | Inf | ||
| sky | -Inf | -Inf | -Inf |
| S/N | 32.5 | 54.0 | 55.0 |
| S/N(c) | 0.0 | 0.0 | 0.0 |
| SN(E/C) |

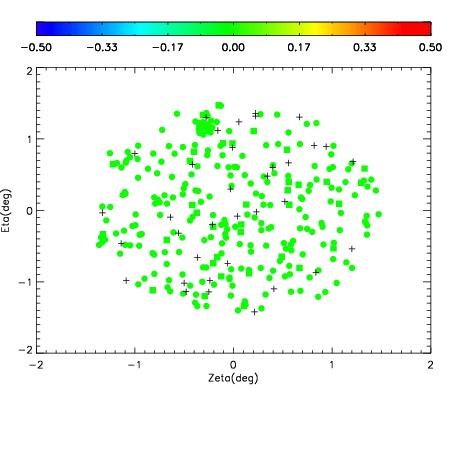
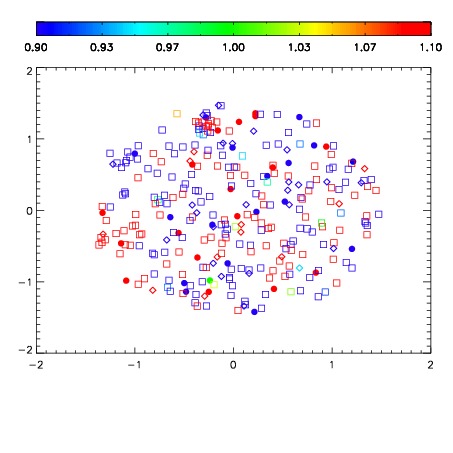
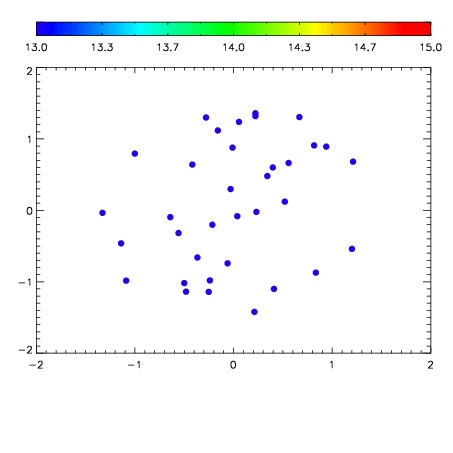

| Frame | Nreads | Zeropoints | Mag plots | Spatial mag deviation | Spatial sky 16325A emission deviations (filled: sky, open: star) | Spatial sky continuum emission | Spatial sky telluric CO2 absorption deviations (filled: H < 10) | |||||||||||||||||||||||
| 0 | 0 |
|
|
|
|
|
|
| IPAIR | NAME | SHIFT | NEWSHIFT | S/N | NAME | SHIFT | NEWSHIFT | S/N |
| 0 | 06930012 | 0.498235 | 0.00000 | 227.154 | 06930013 | 0.00105570 | 0.497179 | 230.082 |
| 1 | 06930019 | 0.492536 | 0.00569898 | 243.401 | 06930018 | 0.000161462 | 0.498074 | 242.270 |
| 2 | 06930015 | 0.495131 | 0.00310400 | 236.928 | 06930017 | 0.00124675 | 0.496988 | 239.220 |
| 3 | 06930016 | 0.495176 | 0.00305900 | 232.646 | 06930010 | 0.00000 | 0.498235 | 235.929 |
| 4 | 06930011 | 0.498149 | 8.59797e-05 | 231.654 | 06930014 | -0.00116179 | 0.499397 | 234.343 |