| Red | Green | Blue | |
| z | 17.64 | ||
| znorm | Inf | ||
| sky | -Inf | -Inf | -Inf |
| S/N | 23.1 | 38.1 | 42.5 |
| S/N(c) | 0.0 | 0.0 | 0.0 |
| SN(E/C) |
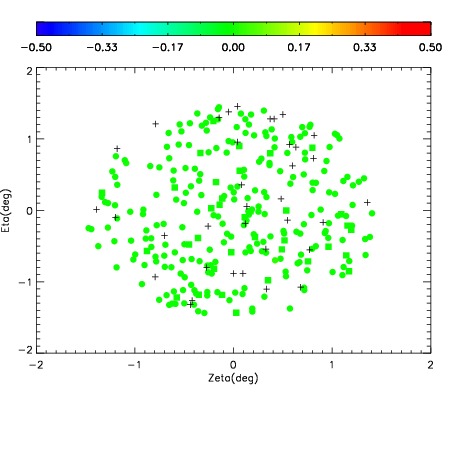
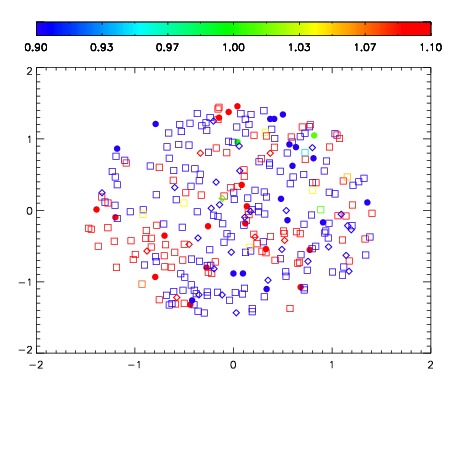
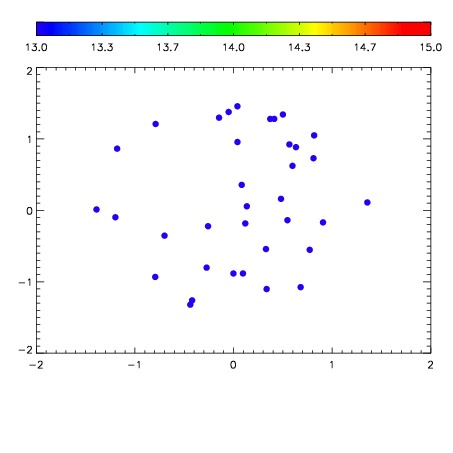

| Frame | Nreads | Zeropoints | Mag plots | Spatial mag deviation | Spatial sky 16325A emission deviations (filled: sky, open: star) | Spatial sky continuum emission | Spatial sky telluric CO2 absorption deviations (filled: H < 10) | |||||||||||||||||||||||
| 0 | 0 |
|
|
|
|
|
|
| IPAIR | NAME | SHIFT | NEWSHIFT | S/N | NAME | SHIFT | NEWSHIFT | S/N |
| 0 | 06320054 | 0.473095 | 0.00000 | 25.5280 | 06320055 | -0.00189967 | 0.474995 | 28.1148 |
| 1 | 06320053 | 0.473076 | 1.90139e-05 | 24.0284 | 06320051 | 0.00140968 | 0.471685 | 23.4072 |
| 2 | 06320050 | 0.472245 | 0.000849992 | 22.3400 | 06320052 | -0.000493614 | 0.473589 | 21.4027 |
| 3 | 06320049 | 0.471521 | 0.00157401 | 18.4672 | 06320048 | 0.00000 | 0.473095 | 15.7539 |