| Red | Green | Blue | |
| z | 17.64 | ||
| znorm | Inf | ||
| sky | -Inf | -Inf | -Inf |
| S/N | 29.7 | 46.3 | 53.4 |
| S/N(c) | 0.0 | 0.0 | 0.0 |
| SN(E/C) |
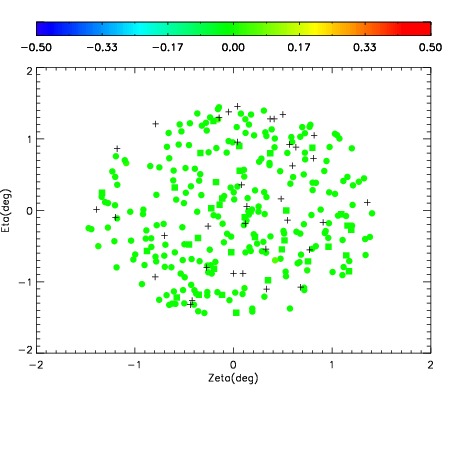
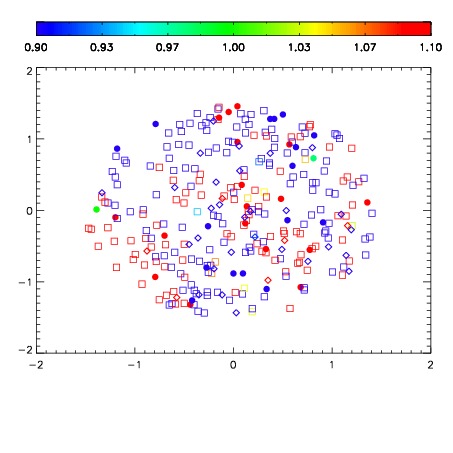
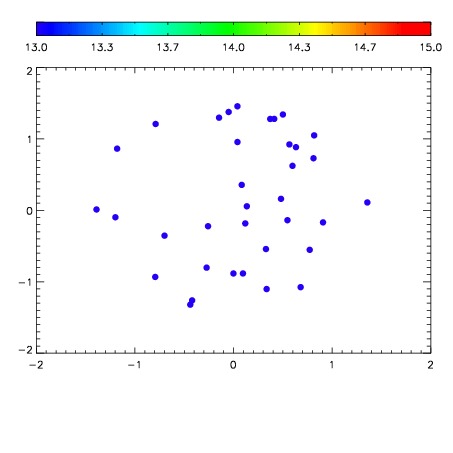

| Frame | Nreads | Zeropoints | Mag plots | Spatial mag deviation | Spatial sky 16325A emission deviations (filled: sky, open: star) | Spatial sky continuum emission | Spatial sky telluric CO2 absorption deviations (filled: H < 10) | |||||||||||||||||||||||
| 0 | 0 |
|
|
|
|
|
|
| IPAIR | NAME | SHIFT | NEWSHIFT | S/N | NAME | SHIFT | NEWSHIFT | S/N |
| 0 | 06640038 | 0.488705 | 0.00000 | 18.7725 | 06640039 | 0.00481044 | 0.483895 | 19.5451 |
| 1 | 06640041 | 0.487521 | 0.00118402 | 20.0349 | 06640040 | 0.00295327 | 0.485752 | 20.0074 |
| 2 | 06640037 | 0.487831 | 0.000874013 | 18.2755 | 06640036 | 0.00000 | 0.488705 | 19.1912 |
| 3 | 06640042 | 0.486872 | 0.00183302 | 16.1371 | 06640043 | 0.00477764 | 0.483927 | 17.7964 |