| Red | Green | Blue | |
| z | 17.64 | ||
| znorm | Inf | ||
| sky | -Inf | -Inf | -Inf |
| S/N | 30.7 | 48.6 | 52.1 |
| S/N(c) | 0.0 | 0.0 | 0.0 |
| SN(E/C) |
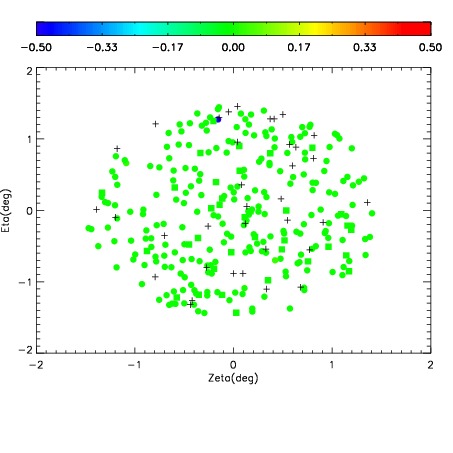
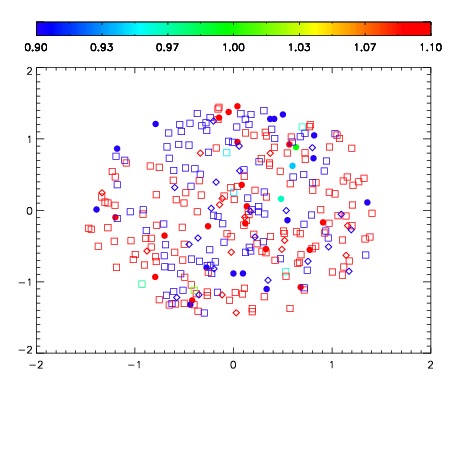
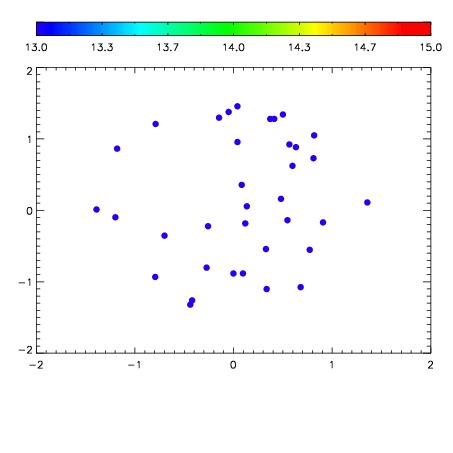

| Frame | Nreads | Zeropoints | Mag plots | Spatial mag deviation | Spatial sky 16325A emission deviations (filled: sky, open: star) | Spatial sky continuum emission | Spatial sky telluric CO2 absorption deviations (filled: H < 10) | |||||||||||||||||||||||
| 0 | 0 |
|
|
|
|
|
|
| IPAIR | NAME | SHIFT | NEWSHIFT | S/N | NAME | SHIFT | NEWSHIFT | S/N |
| 0 | 06920017 | 0.496402 | 0.00000 | 22.9101 | 06920015 | -0.000556658 | 0.496959 | 22.8736 |
| 1 | 06920012 | 0.494609 | 0.00179300 | 24.5269 | 06920011 | 0.00000 | 0.496402 | 25.9760 |
| 2 | 06920016 | 0.495648 | 0.000753999 | 22.3867 | 06920014 | 0.00269958 | 0.493702 | 22.7797 |
| 3 | 06920013 | 0.495302 | 0.00110000 | 22.1048 | 06920018 | 0.00161976 | 0.494782 | 22.6753 |