| Red | Green | Blue | |
| z | 17.64 | ||
| znorm | Inf | ||
| sky | -Inf | -Inf | -Inf |
| S/N | 22.2 | 39.5 | 42.7 |
| S/N(c) | 0.0 | 0.0 | 0.0 |
| SN(E/C) |
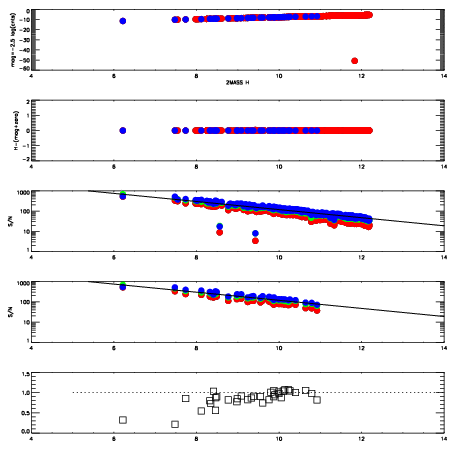
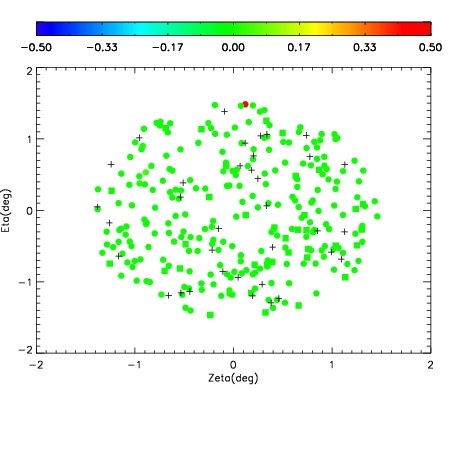
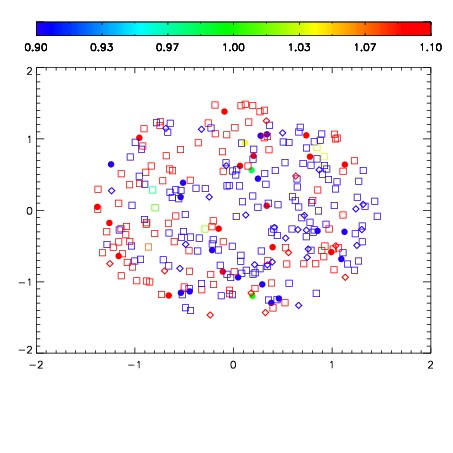
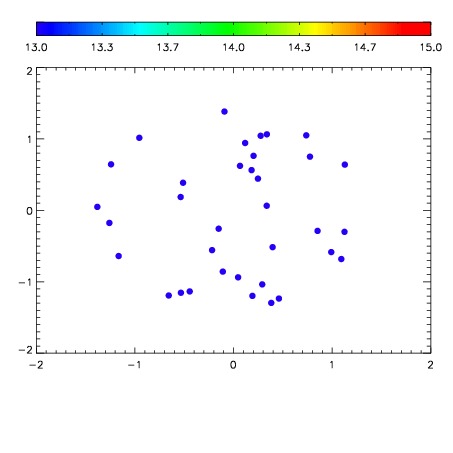

| Frame | Nreads | Zeropoints | Mag plots | Spatial mag deviation | Spatial sky 16325A emission deviations (filled: sky, open: star) | Spatial sky continuum emission | Spatial sky telluric CO2 absorption deviations (filled: H < 10) | |||||||||||||||||||||||
| 0 | 0 |
|
|
|
|
|
|
| IPAIR | NAME | SHIFT | NEWSHIFT | S/N | NAME | SHIFT | NEWSHIFT | S/N |
| 0 | 09980042 | 0.522548 | 0.00000 | 175.443 | 09980043 | 0.00121645 | 0.521332 | 175.079 |
| 1 | 09980037 | 0.521975 | 0.000573039 | 208.469 | 09980036 | 0.00000 | 0.522548 | 210.854 |
| 2 | 09980038 | 0.522270 | 0.000277996 | 202.223 | 09980039 | 0.000529803 | 0.522018 | 202.903 |
| 3 | 09980041 | 0.522425 | 0.000123024 | 192.599 | 09980040 | 0.000484181 | 0.522064 | 183.066 |