| Red | Green | Blue | |
| z | 17.64 | ||
| znorm | Inf | ||
| sky | -Inf | -Inf | -Inf |
| S/N | 28.9 | 49.0 | 53.6 |
| S/N(c) | 0.0 | 0.0 | 0.0 |
| SN(E/C) |
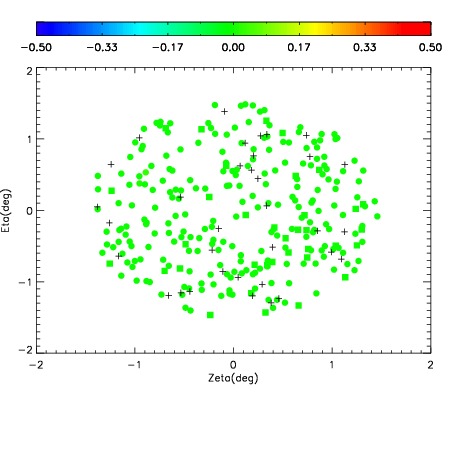
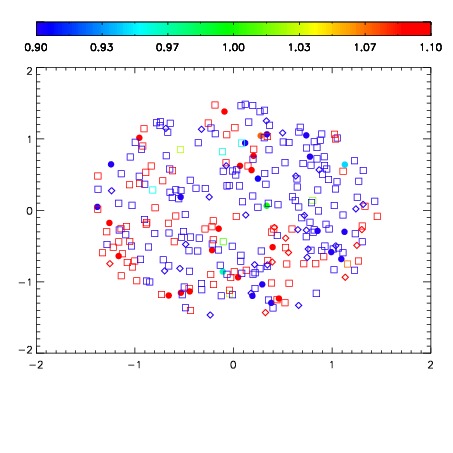
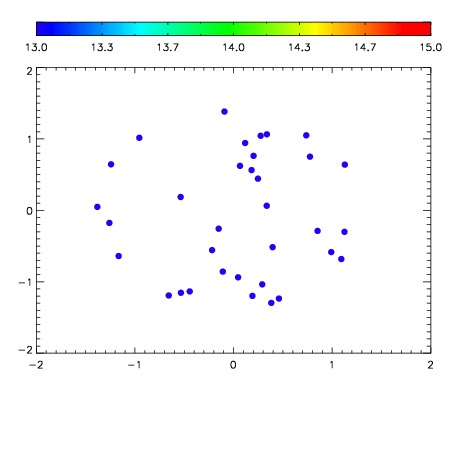

| Frame | Nreads | Zeropoints | Mag plots | Spatial mag deviation | Spatial sky 16325A emission deviations (filled: sky, open: star) | Spatial sky continuum emission | Spatial sky telluric CO2 absorption deviations (filled: H < 10) | |||||||||||||||||||||||
| 0 | 0 |
|
|
|
|
|
|
| IPAIR | NAME | SHIFT | NEWSHIFT | S/N | NAME | SHIFT | NEWSHIFT | S/N |
| 0 | 10150054 | 0.490471 | 0.00000 | 220.334 | 10150055 | -0.00340298 | 0.493874 | 221.288 |
| 1 | 10150053 | 0.489911 | 0.000560015 | 219.993 | 10150048 | 0.00000 | 0.490471 | 218.803 |
| 2 | 10150049 | 0.489408 | 0.00106302 | 216.340 | 10150051 | 0.00127828 | 0.489193 | 216.463 |
| 3 | 10150050 | 0.489783 | 0.000688016 | 211.967 | 10150052 | 0.00136999 | 0.489101 | 216.455 |