| Red | Green | Blue | |
| z | 17.64 | ||
| znorm | Inf | ||
| sky | -Inf | -Inf | -Inf |
| S/N | 28.3 | 47.7 | 51.7 |
| S/N(c) | 0.0 | 0.0 | 0.0 |
| SN(E/C) |
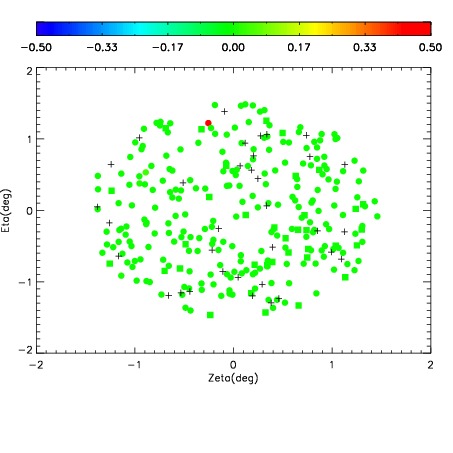
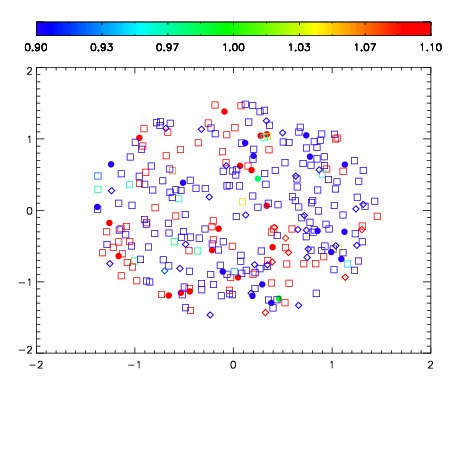
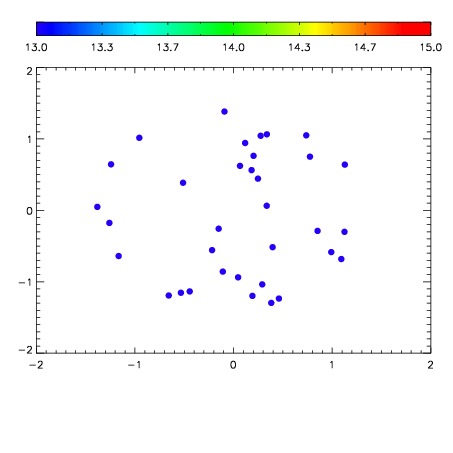

| Frame | Nreads | Zeropoints | Mag plots | Spatial mag deviation | Spatial sky 16325A emission deviations (filled: sky, open: star) | Spatial sky continuum emission | Spatial sky telluric CO2 absorption deviations (filled: H < 10) | |||||||||||||||||||||||
| 0 | 0 |
|
|
|
|
|
|
| IPAIR | NAME | SHIFT | NEWSHIFT | S/N | NAME | SHIFT | NEWSHIFT | S/N |
| 0 | 10240043 | 0.498489 | 0.00000 | 233.898 | 10240044 | -0.000737126 | 0.499226 | 231.588 |
| 1 | 10240038 | 0.497673 | 0.000815988 | 234.415 | 10240037 | 0.00000 | 0.498489 | 232.408 |
| 2 | 10240042 | 0.498457 | 3.19779e-05 | 233.640 | 10240041 | 0.00136674 | 0.497122 | 231.283 |
| 3 | 10240039 | 0.497781 | 0.000707984 | 233.015 | 10240040 | 0.00212786 | 0.496361 | 230.253 |