| Red | Green | Blue | |
| z | 17.64 | ||
| znorm | Inf | ||
| sky | -Inf | -Inf | -Inf |
| S/N | 27.4 | 47.2 | 52.1 |
| S/N(c) | 0.0 | 0.0 | 0.0 |
| SN(E/C) |
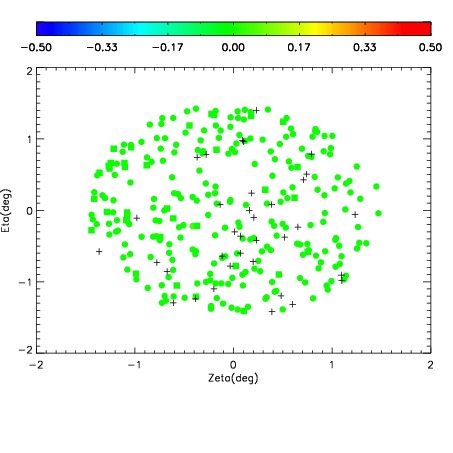
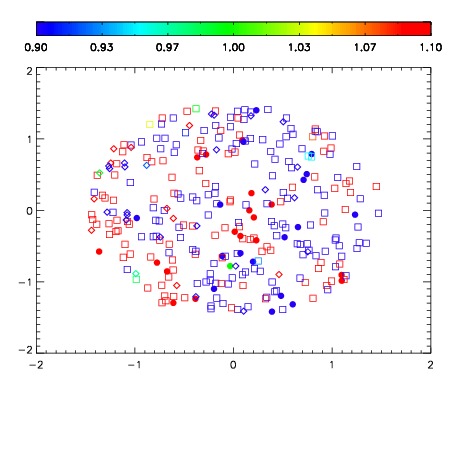


| Frame | Nreads | Zeropoints | Mag plots | Spatial mag deviation | Spatial sky 16325A emission deviations (filled: sky, open: star) | Spatial sky continuum emission | Spatial sky telluric CO2 absorption deviations (filled: H < 10) | |||||||||||||||||||||||
| 0 | 0 |
|
|
|
|
|
|
| IPAIR | NAME | SHIFT | NEWSHIFT | S/N | NAME | SHIFT | NEWSHIFT | S/N |
| 0 | 06690046 | 0.484663 | 0.00000 | 224.078 | 06690040 | 0.00000 | 0.484663 | 224.255 |
| 1 | 06690042 | 0.484572 | 9.10163e-05 | 221.900 | 06690044 | -0.000380142 | 0.485043 | 223.461 |
| 2 | 06690041 | 0.484486 | 0.000176996 | 219.589 | 06690047 | 0.00385731 | 0.480806 | 223.390 |
| 3 | 06690045 | 0.483801 | 0.000862002 | 218.995 | 06690043 | 0.00228915 | 0.482374 | 221.092 |