| Red | Green | Blue | |
| z | 17.64 | ||
| znorm | Inf | ||
| sky | -NaN | -NaN | -Inf |
| S/N | 29.1 | 50.3 | 54.7 |
| S/N(c) | 0.0 | 0.0 | 0.0 |
| SN(E/C) |
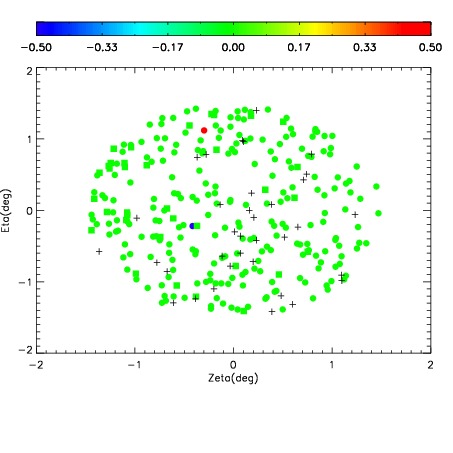
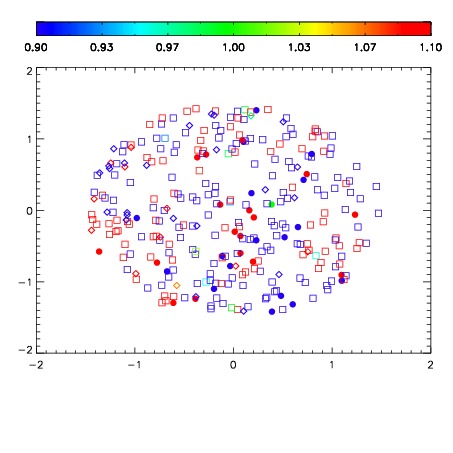
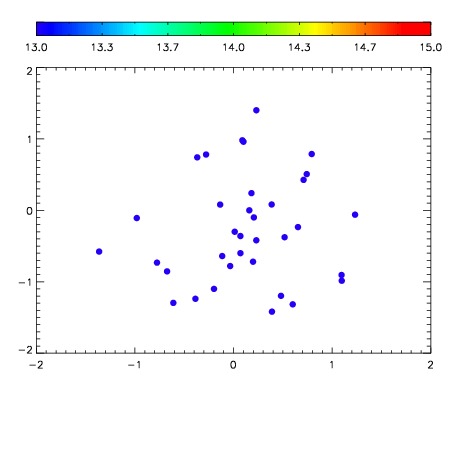

| Frame | Nreads | Zeropoints | Mag plots | Spatial mag deviation | Spatial sky 16325A emission deviations (filled: sky, open: star) | Spatial sky continuum emission | Spatial sky telluric CO2 absorption deviations (filled: H < 10) | |||||||||||||||||||||||
| 0 | 0 |
|
|
|
|
|
|
| IPAIR | NAME | SHIFT | NEWSHIFT | S/N | NAME | SHIFT | NEWSHIFT | S/N |
| 0 | 06930033 | 0.498669 | 0.00000 | 236.244 | 06930034 | 0.00547771 | 0.493191 | 234.037 |
| 1 | 06930032 | 0.498320 | 0.000348985 | 234.378 | 06930030 | 0.00217356 | 0.496495 | 231.637 |
| 2 | 06930029 | 0.494625 | 0.00404400 | 228.607 | 06930031 | 0.000670645 | 0.497998 | 230.751 |
| 3 | 06930028 | 0.494451 | 0.00421801 | 222.781 | 06930027 | 0.00000 | 0.498669 | 218.883 |