| Red | Green | Blue | |
| z | 17.64 | ||
| znorm | Inf | ||
| sky | -Inf | -Inf | -Inf |
| S/N | 27.7 | 47.2 | 50.6 |
| S/N(c) | 0.0 | 0.0 | 0.0 |
| SN(E/C) |
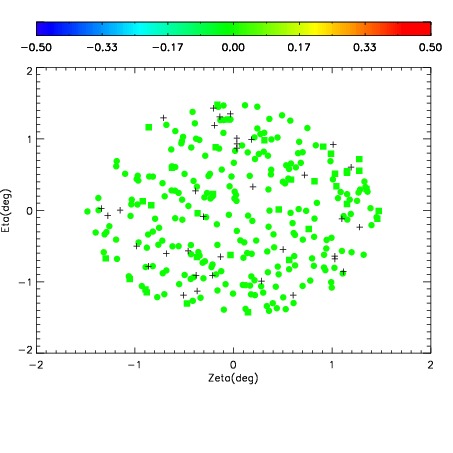
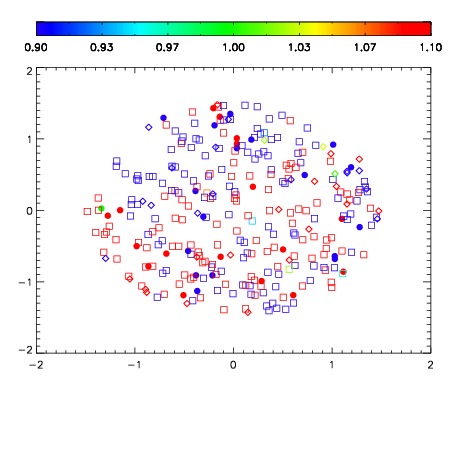
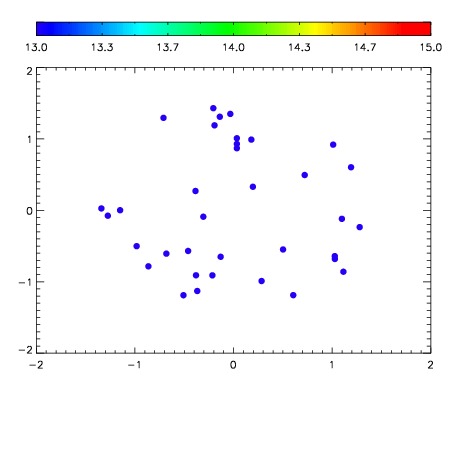

| Frame | Nreads | Zeropoints | Mag plots | Spatial mag deviation | Spatial sky 16325A emission deviations (filled: sky, open: star) | Spatial sky continuum emission | Spatial sky telluric CO2 absorption deviations (filled: H < 10) | |||||||||||||||||||||||
| 0 | 0 |
|
|
|
|
|
|
| IPAIR | NAME | SHIFT | NEWSHIFT | S/N | NAME | SHIFT | NEWSHIFT | S/N |
| 0 | 06920054 | 0.500013 | 0.00000 | 160.613 | 06920055 | 0.00503447 | 0.494979 | 158.727 |
| 1 | 06920058 | 0.498800 | 0.00121298 | 165.233 | 06920059 | 0.00374186 | 0.496271 | 168.213 |
| 2 | 06920057 | 0.498780 | 0.00123298 | 163.316 | 06920056 | 0.00317578 | 0.496837 | 161.274 |
| 3 | 06920053 | 0.499342 | 0.000670999 | 151.292 | 06920052 | 0.00000 | 0.500013 | 151.933 |