| Red | Green | Blue | |
| z | 17.64 | ||
| znorm | Inf | ||
| sky | -Inf | -Inf | -Inf |
| S/N | 25.4 | 42.1 | 44.7 |
| S/N(c) | 0.0 | 0.0 | 0.0 |
| SN(E/C) |
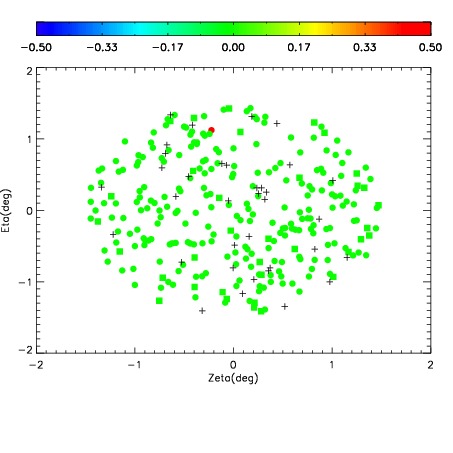
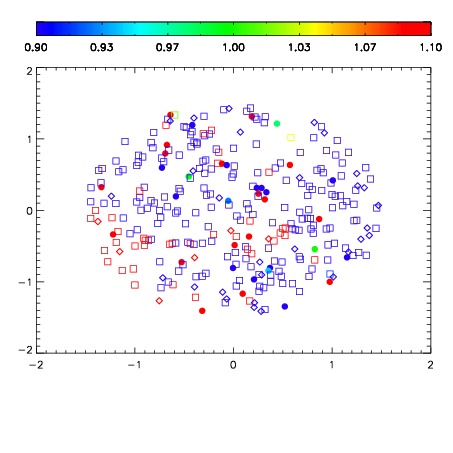
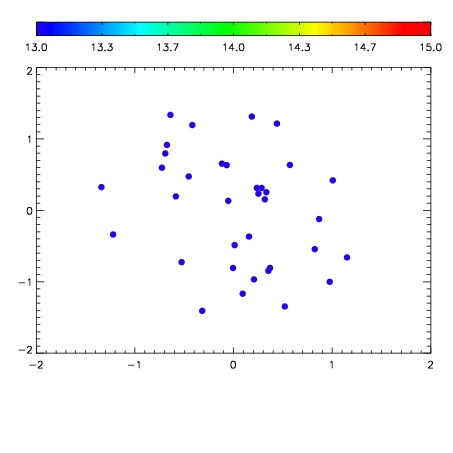

| Frame | Nreads | Zeropoints | Mag plots | Spatial mag deviation | Spatial sky 16325A emission deviations (filled: sky, open: star) | Spatial sky continuum emission | Spatial sky telluric CO2 absorption deviations (filled: H < 10) | |||||||||||||||||||||||
| 0 | 0 |
|
|
|
|
|
|
| IPAIR | NAME | SHIFT | NEWSHIFT | S/N | NAME | SHIFT | NEWSHIFT | S/N |
| 0 | 06120030 | 0.480348 | 0.00000 | 234.488 | 06120032 | -0.00288191 | 0.483230 | 234.632 |
| 1 | 06120031 | 0.480145 | 0.000202984 | 235.502 | 06120029 | 0.00000 | 0.480348 | 235.825 |
| 2 | 06120034 | 0.478764 | 0.00158399 | 216.828 | 06120033 | -0.00340448 | 0.483752 | 231.813 |