| Red | Green | Blue | |
| z | 17.64 | ||
| znorm | Inf | ||
| sky | -Inf | -Inf | -Inf |
| S/N | 29.1 | 46.1 | 53.0 |
| S/N(c) | 0.0 | 0.0 | 0.0 |
| SN(E/C) |
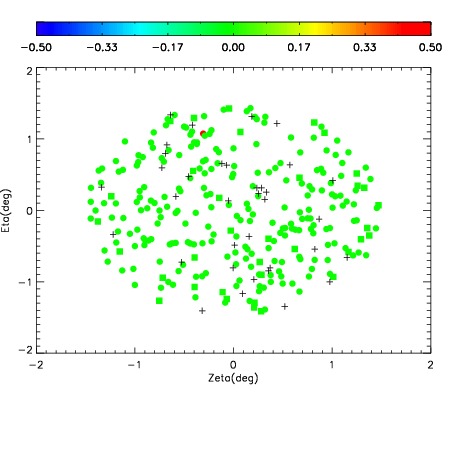
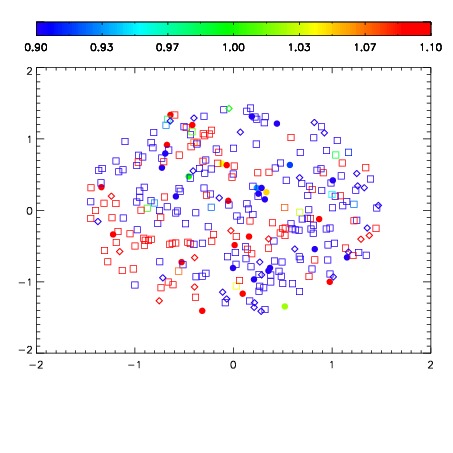
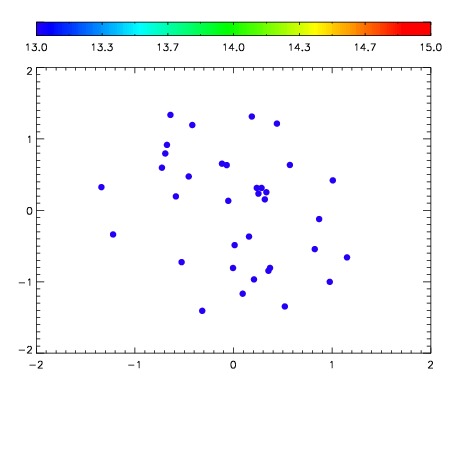

| Frame | Nreads | Zeropoints | Mag plots | Spatial mag deviation | Spatial sky 16325A emission deviations (filled: sky, open: star) | Spatial sky continuum emission | Spatial sky telluric CO2 absorption deviations (filled: H < 10) | |||||||||||||||||||||||
| 0 | 0 |
|
|
|
|
|
|
| IPAIR | NAME | SHIFT | NEWSHIFT | S/N | NAME | SHIFT | NEWSHIFT | S/N |
| 0 | 06690057 | 0.484510 | 0.00000 | 228.274 | 06690058 | 0.00675236 | 0.477758 | 227.348 |
| 1 | 06690056 | 0.484123 | 0.000387013 | 227.894 | 06690051 | 0.00000 | 0.484510 | 225.365 |
| 2 | 06690052 | 0.482744 | 0.00176600 | 220.661 | 06690055 | 0.000552417 | 0.483958 | 224.684 |
| 3 | 06690053 | 0.483395 | 0.00111499 | 216.827 | 06690054 | 0.00395496 | 0.480555 | 221.766 |