| Red | Green | Blue | |
| z | 17.64 | ||
| znorm | Inf | ||
| sky | -Inf | -Inf | -Inf |
| S/N | 27.3 | 46.7 | 51.3 |
| S/N(c) | 0.0 | 0.0 | 0.0 |
| SN(E/C) |
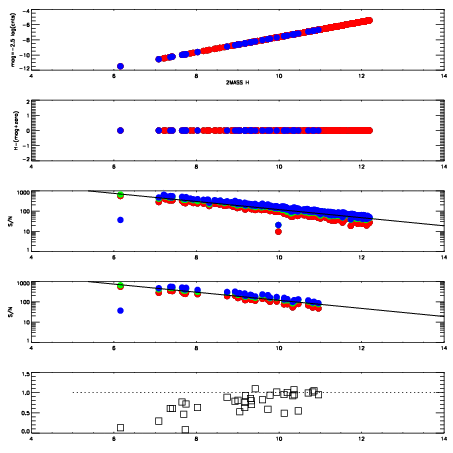
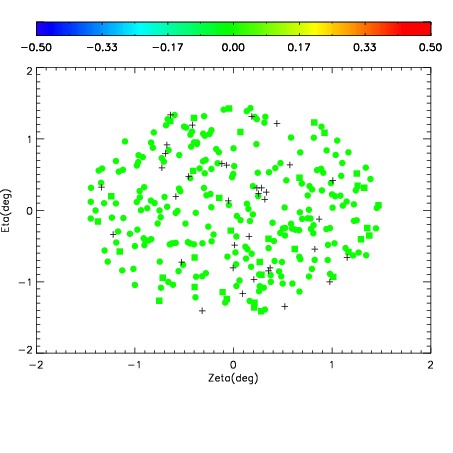
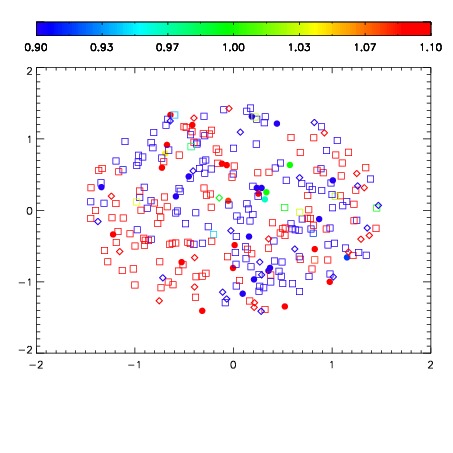
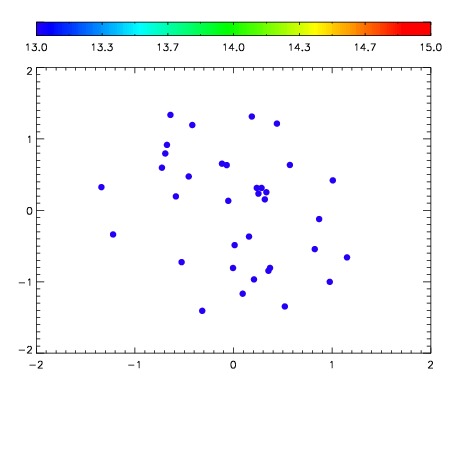

| Frame | Nreads | Zeropoints | Mag plots | Spatial mag deviation | Spatial sky 16325A emission deviations (filled: sky, open: star) | Spatial sky continuum emission | Spatial sky telluric CO2 absorption deviations (filled: H < 10) | |||||||||||||||||||||||
| 0 | 0 |
|
|
|
|
|
|
| IPAIR | NAME | SHIFT | NEWSHIFT | S/N | NAME | SHIFT | NEWSHIFT | S/N |
| 0 | 06740027 | 0.493015 | 0.00000 | 224.645 | 06740025 | 0.00000 | 0.493015 | 214.413 |
| 1 | 06740030 | 0.490035 | 0.00297999 | 229.610 | 06740029 | 5.34431e-05 | 0.492962 | 227.561 |
| 2 | 06740031 | 0.491037 | 0.00197798 | 228.657 | 06740028 | -0.000772548 | 0.493788 | 226.621 |
| 3 | 06740026 | 0.491635 | 0.00138000 | 225.066 | 06740032 | 0.00315432 | 0.489861 | 225.692 |