| Red | Green | Blue | |
| z | 17.64 | ||
| znorm | Inf | ||
| sky | -Inf | -Inf | -Inf |
| S/N | 26.3 | 40.8 | 46.4 |
| S/N(c) | 0.0 | 0.0 | 0.0 |
| SN(E/C) |
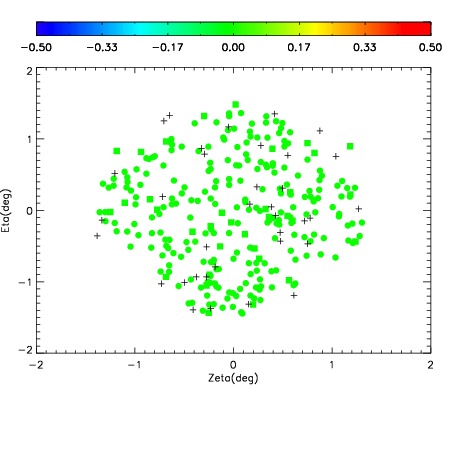
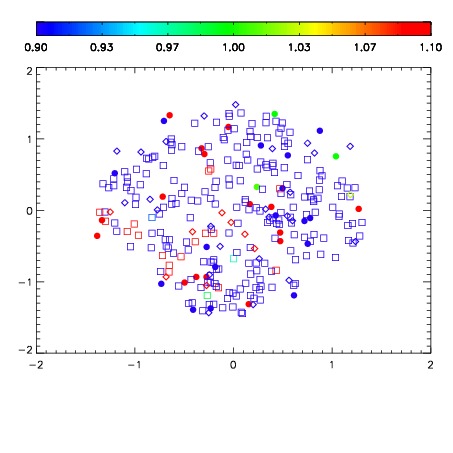
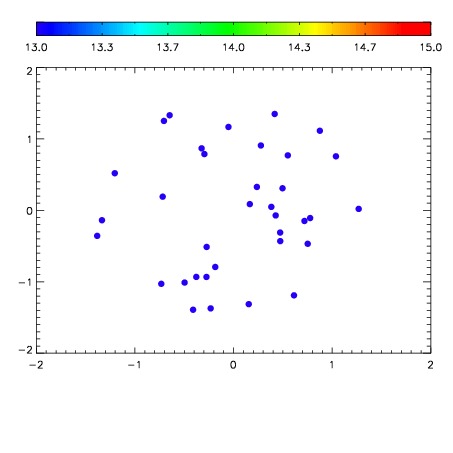

| Frame | Nreads | Zeropoints | Mag plots | Spatial mag deviation | Spatial sky 16325A emission deviations (filled: sky, open: star) | Spatial sky continuum emission | Spatial sky telluric CO2 absorption deviations (filled: H < 10) | |||||||||||||||||||||||
| 0 | 0 |
|
|
|
|
|
|
| IPAIR | NAME | SHIFT | NEWSHIFT | S/N | NAME | SHIFT | NEWSHIFT | S/N |
| 0 | 08760064 | 0.473242 | 0.00000 | 172.744 | 08760070 | 0.00326753 | 0.469974 | 167.702 |
| 1 | 08760069 | 0.470794 | 0.00244802 | 177.604 | 08760067 | 0.00152896 | 0.471713 | 181.721 |
| 2 | 08760065 | 0.472903 | 0.000339001 | 176.456 | 08760066 | 0.00232304 | 0.470919 | 180.738 |
| 3 | 08760068 | 0.470963 | 0.00227901 | 172.991 | 08760063 | 0.00000 | 0.473242 | 175.757 |