| Red | Green | Blue | |
| z | 17.64 | ||
| znorm | Inf | ||
| sky | -Inf | -Inf | -Inf |
| S/N | 35.0 | 56.0 | 57.9 |
| S/N(c) | 0.0 | 0.0 | 0.0 |
| SN(E/C) |

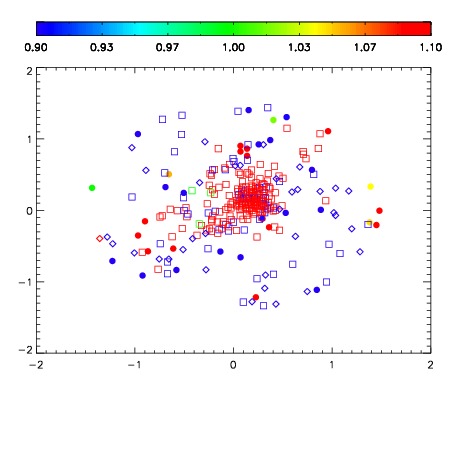
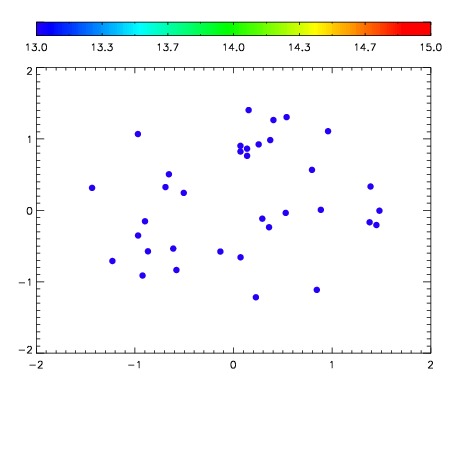

| Frame | Nreads | Zeropoints | Mag plots | Spatial mag deviation | Spatial sky 16325A emission deviations (filled: sky, open: star) | Spatial sky continuum emission | Spatial sky telluric CO2 absorption deviations (filled: H < 10) | |||||||||||||||||||||||
| 0 | 0 |
|
|
|
|
|
|
| IPAIR | NAME | SHIFT | NEWSHIFT | S/N | NAME | SHIFT | NEWSHIFT | S/N |
| 0 | 06060064 | 0.490054 | 0.00000 | 255.106 | 06060061 | 0.00114846 | 0.488906 | 254.243 |
| 1 | 06060063 | 0.489682 | 0.000372022 | 255.927 | 06060065 | 0.00407905 | 0.485975 | 255.303 |
| 2 | 06060060 | 0.488889 | 0.00116500 | 255.073 | 06060062 | 0.000198648 | 0.489855 | 253.855 |
| 3 | 06060059 | 0.487566 | 0.00248802 | 254.081 | 06060058 | 0.00000 | 0.490054 | 252.987 |