| Red | Green | Blue | |
| z | 17.64 | ||
| znorm | Inf | ||
| sky | -Inf | -Inf | -Inf |
| S/N | 34.0 | 55.0 | 55.0 |
| S/N(c) | 0.0 | 0.0 | 0.0 |
| SN(E/C) |
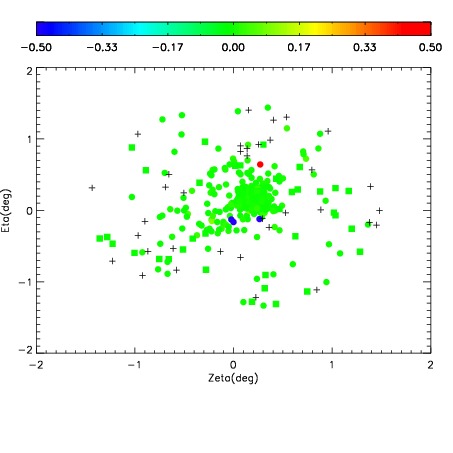
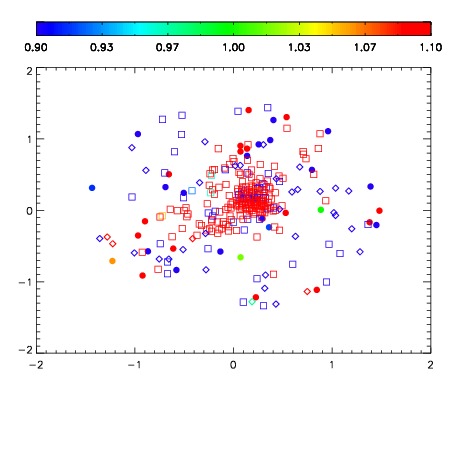
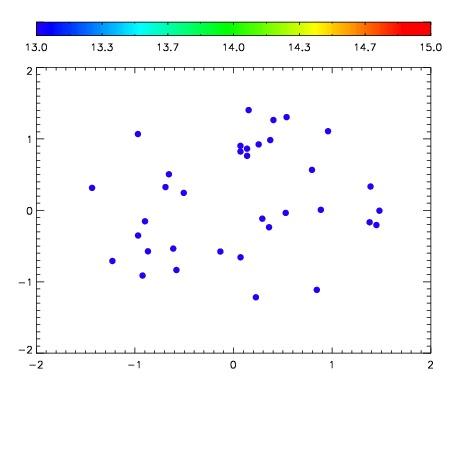

| Frame | Nreads | Zeropoints | Mag plots | Spatial mag deviation | Spatial sky 16325A emission deviations (filled: sky, open: star) | Spatial sky continuum emission | Spatial sky telluric CO2 absorption deviations (filled: H < 10) | |||||||||||||||||||||||
| 0 | 0 |
|
|
|
|
|
|
| IPAIR | NAME | SHIFT | NEWSHIFT | S/N | NAME | SHIFT | NEWSHIFT | S/N |
| 0 | 06100091 | 0.485129 | 0.00000 | 269.832 | 06100092 | 0.00281310 | 0.482316 | 250.264 |
| 1 | 06100090 | 0.484660 | 0.000468999 | 275.052 | 06100088 | 0.000369440 | 0.484760 | 273.891 |
| 2 | 06100087 | 0.484530 | 0.000598997 | 274.410 | 06100089 | 0.000608238 | 0.484521 | 272.199 |
| 3 | 06100086 | 0.484390 | 0.000739008 | 273.126 | 06100085 | 0.00000 | 0.485129 | 271.308 |