| Red | Green | Blue | |
| z | 17.64 | ||
| znorm | Inf | ||
| sky | -NaN | -Inf | -NaN |
| S/N | 27.7 | 46.8 | 45.5 |
| S/N(c) | 0.0 | 0.0 | 0.0 |
| SN(E/C) |
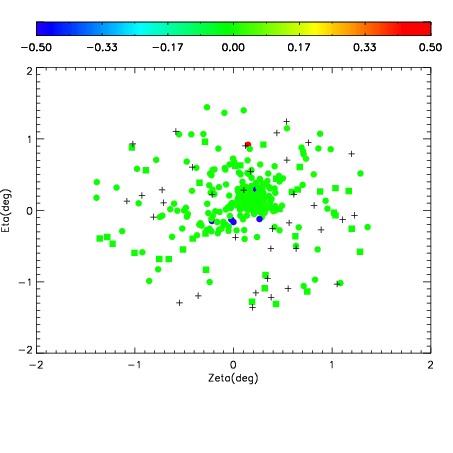
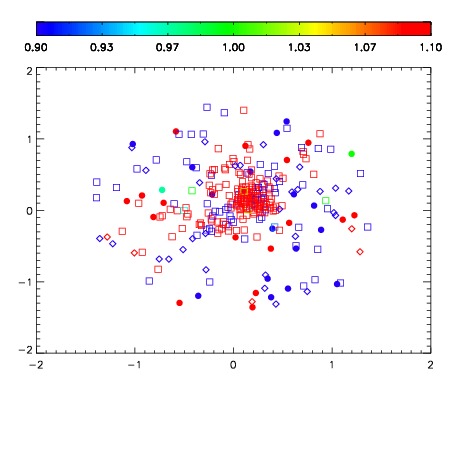
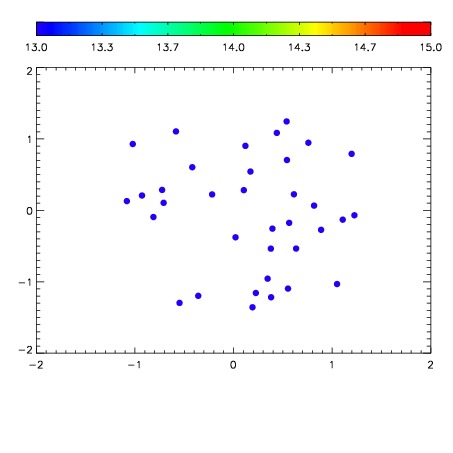

| Frame | Nreads | Zeropoints | Mag plots | Spatial mag deviation | Spatial sky 16325A emission deviations (filled: sky, open: star) | Spatial sky continuum emission | Spatial sky telluric CO2 absorption deviations (filled: H < 10) | |||||||||||||||||||||||
| 0 | 0 |
|
|
|
|
|
|
| IPAIR | NAME | SHIFT | NEWSHIFT | S/N | NAME | SHIFT | NEWSHIFT | S/N |
| 0 | 06080070 | 0.487164 | 0.00000 | 161.671 | 06080069 | 0.00000 | 0.487164 | 161.488 |
| 1 | 06080074 | 0.484752 | 0.00241199 | 194.747 | 06080073 | -0.00222583 | 0.489390 | 194.494 |
| 2 | 06080075 | 0.484848 | 0.00231600 | 180.901 | 06080072 | 0.00172520 | 0.485439 | 190.756 |
| 3 | 06080071 | 0.486386 | 0.000777990 | 179.311 | 06080076 | 0.000309434 | 0.486855 | 182.005 |