| Frame | Nreads | Zeropoints | Mag plots
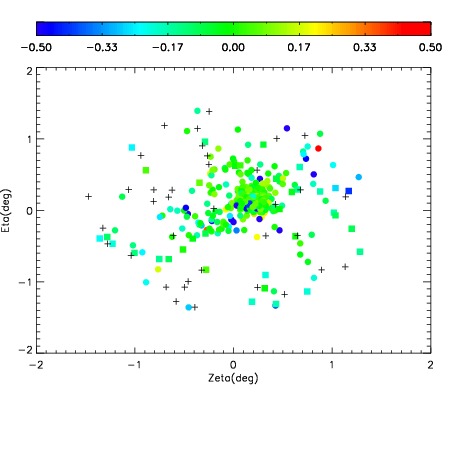
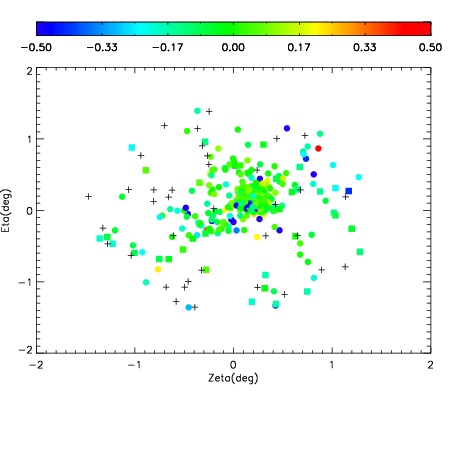
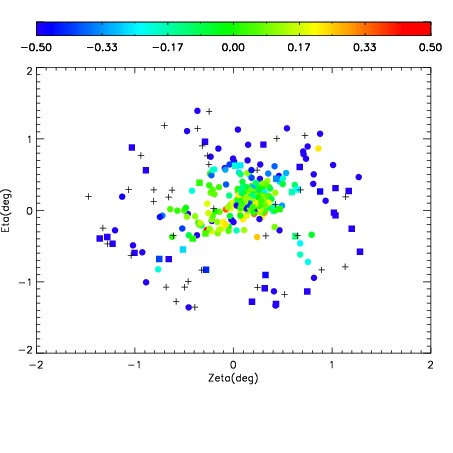
| Spatial mag deviation
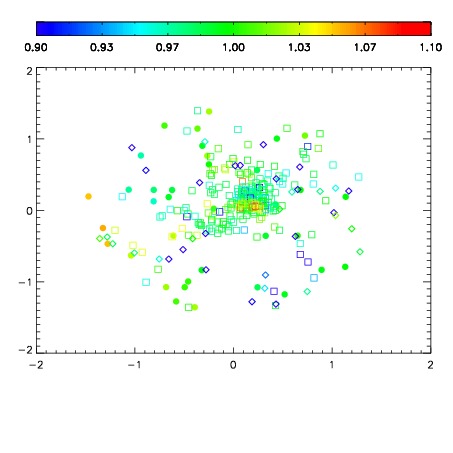
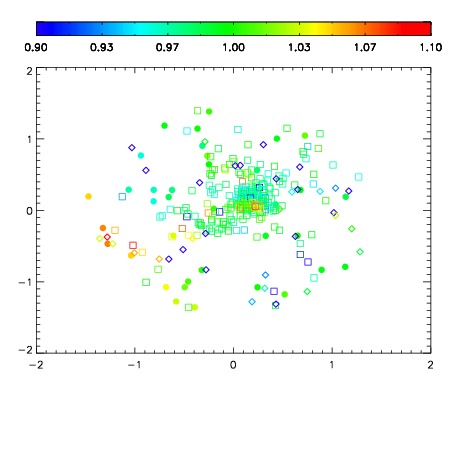
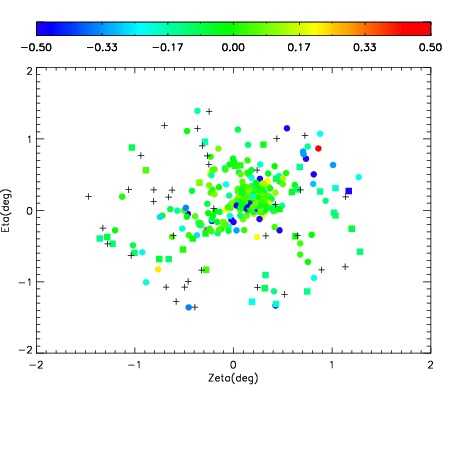
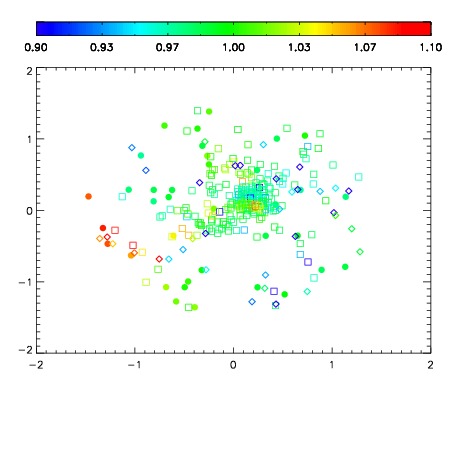
| Spatial sky 16325A emission deviations (filled: sky, open: star)
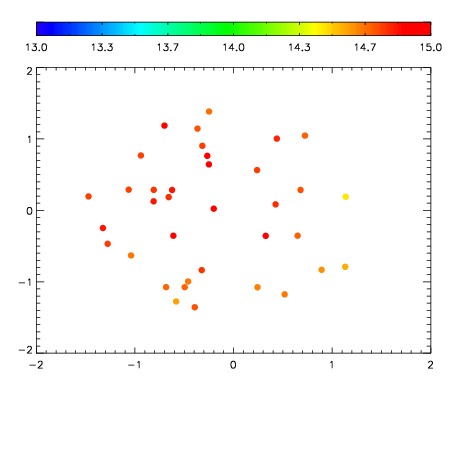
| Spatial sky continuum emission
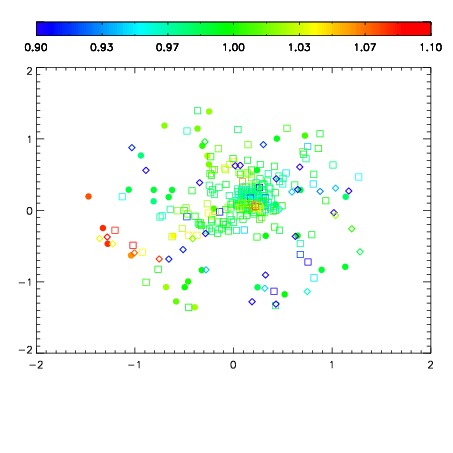
| Spatial sky telluric CO2 absorption deviations (filled: H < 10)
|
| 6090084
| 47
| | Red | Green | Blue
| | z | | 19.03
| | znorm | | 14.85
| | sky | 15.1 | 14.7 | 14.8
| | S/N | 16.1 | 25.6 | 26.6
| | S/N(c) | 14.7 | 24.4 | 24.8
| | SN(E/C) 0.65
|
| 
| 
| 
| 
| 
|
| 6090085
| 47
| | Red | Green | Blue
| | z | | 18.96
| | znorm | | 14.78
| | sky | 14.9 | 14.6 | 15.3
| | S/N | 15.4 | 24.1 | 25.1
| | S/N(c) | 14.2 | 23.3 | 23.8
| | SN(E/C) 0.65
|
| 
| 
| 
| 
| 
|
| 6090086
| 47
| | Red | Green | Blue
| | z | | 18.95
| | znorm | | 14.77
| | sky | 15.2 | 15.1 | 15.4
| | S/N | 15.2 | 24.1 | 24.9
| | S/N(c) | 14.0 | 23.0 | 23.6
| | SN(E/C) 0.71
|
| 
| 
| 
| 
| 
|
| 6090087
| 47
| | Red | Green | Blue
| | z | | 19.03
| | znorm | | 14.85
| | sky | 15.3 | 15.0 | 15.3
| | S/N | 16.5 | 25.5 | 26.0
| | S/N(c) | 15.0 | 24.3 | 24.4
| | SN(E/C) 0.67
|
| 
| 
| 
| 
| 
|
| 6090088
| 47
| | Red | Green | Blue
| | z | | 18.99
| | znorm | | 14.81
| | sky | 15.0 | 14.8 | 15.5
| | S/N | 15.9 | 24.7 | 25.2
| | S/N(c) | 14.5 | 23.6 | 23.6
| | SN(E/C) 0.62
|
| 
| 
| 
| 
| 
|
| 6090089
| 47
| | Red | Green | Blue
| | z | | 19.08
| | znorm | | 14.90
| | sky | 14.9 | 14.9 | 15.2
| | S/N | 16.8 | 26.4 | 26.6
| | S/N(c) | 15.4 | 24.8 | 24.7
| | SN(E/C) 0.60
|
| 
| 
| 
| 
| 
|
| 6090090
| 47
| | Red | Green | Blue
| | z | | 19.17
| | znorm | | 14.99
| | sky | 14.9 | 14.8 | 15.2
| | S/N | 17.9 | 27.6 | 28.1
| | S/N(c) | 16.5 | 26.1 | 26.2
| | SN(E/C) 0.64
|
| 
| 
| 
| 
| 
|
| 6090091
| 47
| | Red | Green | Blue
| | z | | 19.22
| | znorm | | 15.04
| | sky | 14.7 | 14.8 | 15.1
| | S/N | 18.1 | 28.5 | 28.9
| | S/N(c) | 16.7 | 26.8 | 26.9
| | SN(E/C) 0.57
|
| 
| 
| 
| 
| 
|
| 6090092
| 47
| | Red | Green | Blue
| | z | | 19.13
| | znorm | | 14.95
| | sky | 14.7 | 15.0 | 15.2
| | S/N | 17.3 | 26.8 | 27.1
| | S/N(c) | 15.9 | 25.3 | 25.2
| | SN(E/C) 0.65
|
| 
| 
| 
| 
| 
|
| 6090093
| 47
| | Red | Green | Blue
| | z | | 19.02
| | znorm | | 14.84
| | sky | 15.0 | 14.8 | 14.8
| | S/N | 17.5 | 26.9 | 27.2
| | S/N(c) | 15.9 | 25.3 | 25.3
| | SN(E/C) 0.74
|
| 
| 
| 
| 
| 
|