| Red | Green | Blue | |
| z | 17.64 | ||
| znorm | Inf | ||
| sky | -Inf | -Inf | -Inf |
| S/N | 33.9 | 55.3 | 54.6 |
| S/N(c) | 0.0 | 0.0 | 0.0 |
| SN(E/C) |
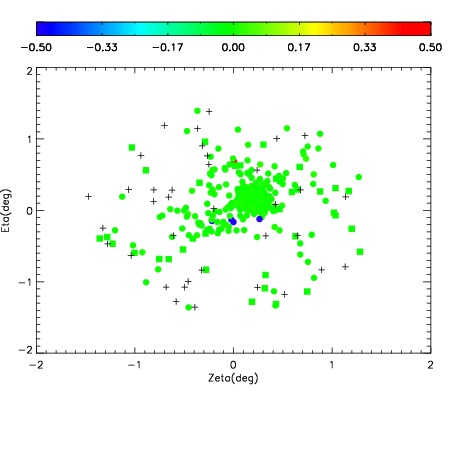
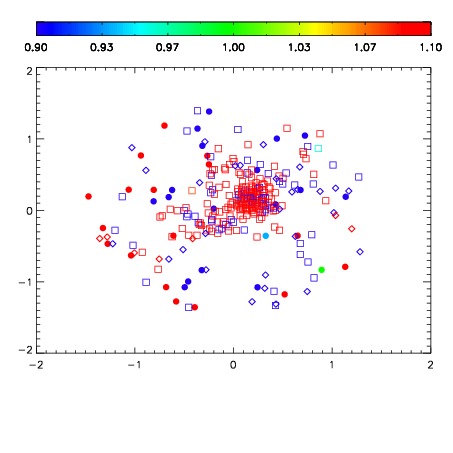
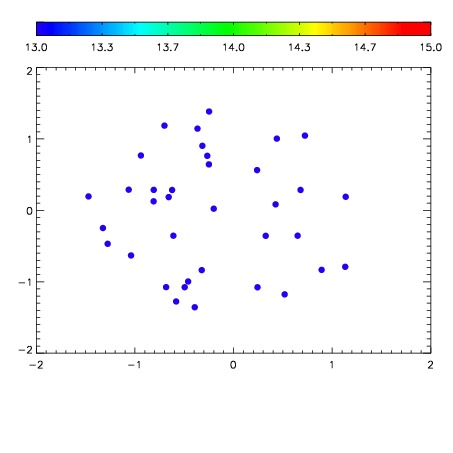

| Frame | Nreads | Zeropoints | Mag plots | Spatial mag deviation | Spatial sky 16325A emission deviations (filled: sky, open: star) | Spatial sky continuum emission | Spatial sky telluric CO2 absorption deviations (filled: H < 10) | |||||||||||||||||||||||
| 0 | 0 |
|
|
|
|
|
|
| IPAIR | NAME | SHIFT | NEWSHIFT | S/N | NAME | SHIFT | NEWSHIFT | S/N |
| 0 | 06090090 | 0.481174 | 0.00000 | 168.920 | 06090091 | 0.00355473 | 0.477619 | 173.153 |
| 1 | 06090089 | 0.480460 | 0.000714004 | 160.458 | 06090092 | 0.00216189 | 0.479012 | 166.156 |
| 2 | 06090085 | 0.478586 | 0.00258800 | 150.833 | 06090088 | -0.000593494 | 0.481767 | 155.031 |
| 3 | 06090086 | 0.480102 | 0.00107199 | 149.927 | 06090087 | 0.00104725 | 0.480127 | 154.775 |
| 4 | 06090093 | 0.480907 | 0.000266999 | 117.948 | 06090084 | 0.00000 | 0.481174 | 154.447 |