| Red | Green | Blue | |
| z | 17.64 | ||
| znorm | Inf | ||
| sky | -Inf | -Inf | -Inf |
| S/N | 26.5 | 44.5 | 44.4 |
| S/N(c) | 0.0 | 0.0 | 0.0 |
| SN(E/C) |

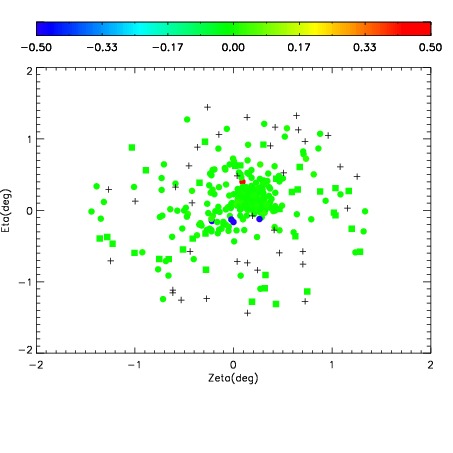
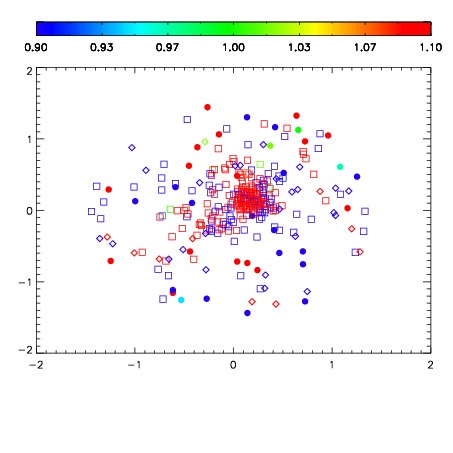
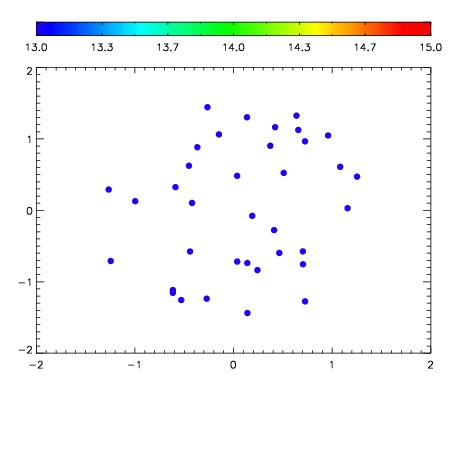

| Frame | Nreads | Zeropoints | Mag plots | Spatial mag deviation | Spatial sky 16325A emission deviations (filled: sky, open: star) | Spatial sky continuum emission | Spatial sky telluric CO2 absorption deviations (filled: H < 10) | |||||||||||||||||||||||
| 0 | 0 |
|
|
|
|
|
|
| IPAIR | NAME | SHIFT | NEWSHIFT | S/N | NAME | SHIFT | NEWSHIFT | S/N |
| 0 | 07200032 | 0.476696 | 0.00000 | 181.034 | 07200033 | 0.00299433 | 0.473702 | 186.172 |
| 1 | 07200027 | 0.474205 | 0.00249103 | 206.229 | 07200026 | 0.00000 | 0.476696 | 210.109 |
| 2 | 07200028 | 0.474925 | 0.00177100 | 201.706 | 07200029 | 0.000237942 | 0.476458 | 206.437 |
| 3 | 07200031 | 0.476432 | 0.000264019 | 188.337 | 07200030 | 0.00141412 | 0.475282 | 194.711 |