| Red | Green | Blue | |
| z | 17.64 | ||
| znorm | Inf | ||
| sky | -Inf | -Inf | -Inf |
| S/N | 28.5 | 47.4 | 46.3 |
| S/N(c) | 0.0 | 0.0 | 0.0 |
| SN(E/C) |

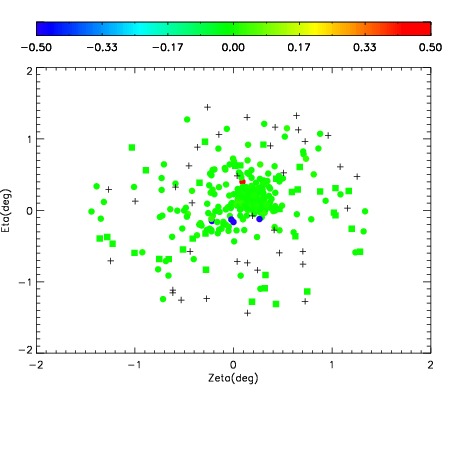
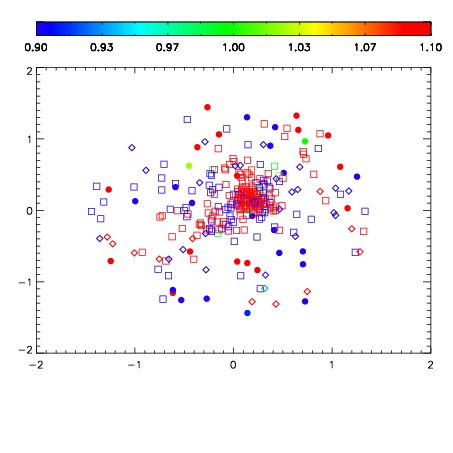
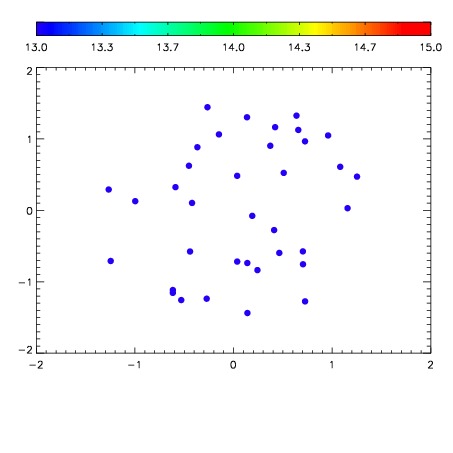

| Frame | Nreads | Zeropoints | Mag plots | Spatial mag deviation | Spatial sky 16325A emission deviations (filled: sky, open: star) | Spatial sky continuum emission | Spatial sky telluric CO2 absorption deviations (filled: H < 10) | |||||||||||||||||||||||
| 0 | 0 |
|
|
|
|
|
|
| IPAIR | NAME | SHIFT | NEWSHIFT | S/N | NAME | SHIFT | NEWSHIFT | S/N |
| 0 | 07210028 | 0.484092 | 0.00000 | 207.403 | 07210030 | -0.00184351 | 0.485936 | 203.636 |
| 1 | 07210032 | 0.483877 | 0.000214994 | 217.627 | 07210029 | -0.00206720 | 0.486159 | 212.673 |
| 2 | 07210031 | 0.483628 | 0.000463992 | 207.328 | 07210033 | 0.00184584 | 0.482246 | 200.640 |
| 3 | 07210027 | 0.483690 | 0.000402004 | 202.981 | 07210026 | 0.00000 | 0.484092 | 199.229 |