| Red | Green | Blue | |
| z | 17.64 | ||
| znorm | Inf | ||
| sky | -Inf | -Inf | -Inf |
| S/N | 25.7 | 43.6 | 46.8 |
| S/N(c) | 0.0 | 0.0 | 0.0 |
| SN(E/C) |

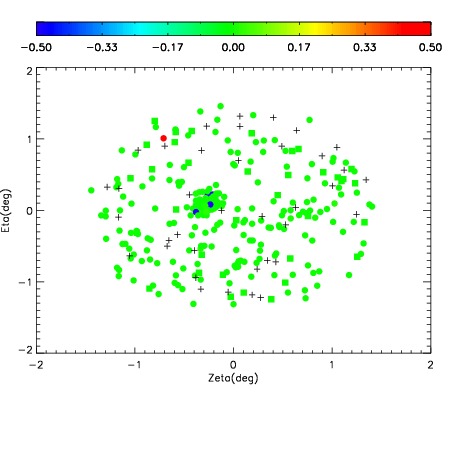
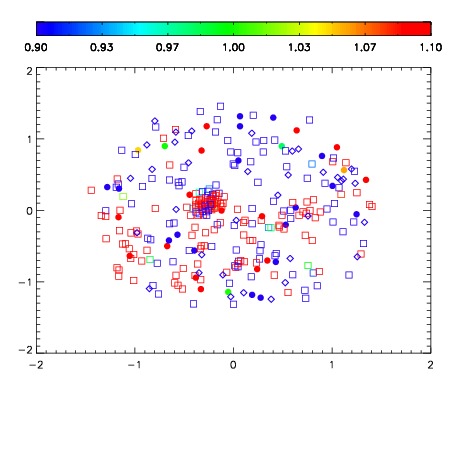
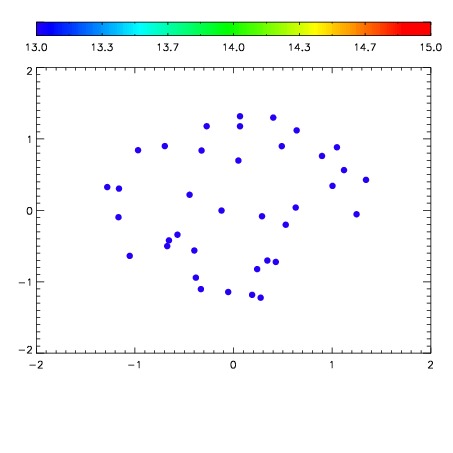

| Frame | Nreads | Zeropoints | Mag plots | Spatial mag deviation | Spatial sky 16325A emission deviations (filled: sky, open: star) | Spatial sky continuum emission | Spatial sky telluric CO2 absorption deviations (filled: H < 10) | |||||||||||||||||||||||
| 0 | 0 |
|
|
|
|
|
|
| IPAIR | NAME | SHIFT | NEWSHIFT | S/N | NAME | SHIFT | NEWSHIFT | S/N |
| 0 | 09990038 | 0.520687 | 0.00000 | 227.040 | 09990040 | -0.00260777 | 0.523295 | 221.359 |
| 1 | 09990043 | 0.515487 | 0.00519997 | 236.862 | 09990044 | -0.00371081 | 0.524398 | 234.015 |
| 2 | 09990039 | 0.519908 | 0.000778973 | 236.183 | 09990041 | -0.00328895 | 0.523976 | 230.063 |
| 3 | 09990042 | 0.515500 | 0.00518698 | 206.581 | 09990037 | 0.00000 | 0.520687 | 186.961 |