| Red | Green | Blue | |
| z | 17.64 | ||
| znorm | Inf | ||
| sky | -Inf | -Inf | -Inf |
| S/N | 30.4 | 49.3 | 51.4 |
| S/N(c) | 0.0 | 0.0 | 0.0 |
| SN(E/C) |
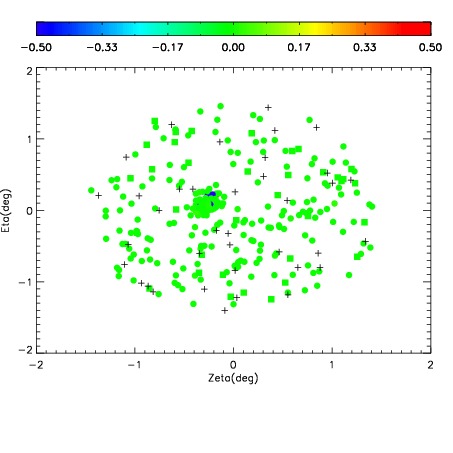
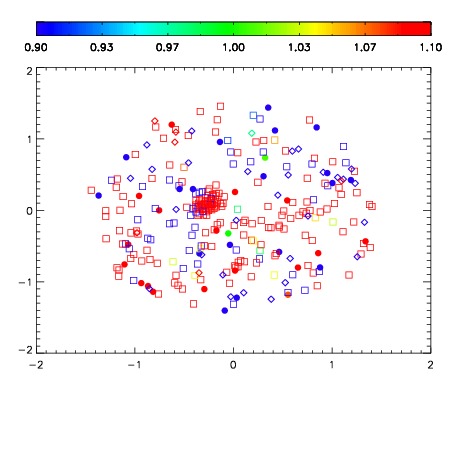
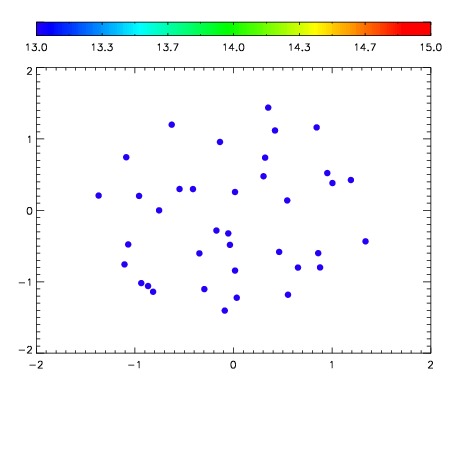

| Frame | Nreads | Zeropoints | Mag plots | Spatial mag deviation | Spatial sky 16325A emission deviations (filled: sky, open: star) | Spatial sky continuum emission | Spatial sky telluric CO2 absorption deviations (filled: H < 10) | |||||||||||||||||||||||
| 0 | 0 |
|
|
|
|
|
|
| IPAIR | NAME | SHIFT | NEWSHIFT | S/N | NAME | SHIFT | NEWSHIFT | S/N |
| 0 | 06740012 | 0.486449 | 0.00000 | 219.533 | 06740017 | -0.000515401 | 0.486964 | 217.527 |
| 1 | 06740016 | 0.484104 | 0.00234500 | 225.889 | 06740014 | -0.00198041 | 0.488429 | 224.352 |
| 2 | 06740015 | 0.482967 | 0.00348201 | 223.954 | 06740013 | 0.00147920 | 0.484970 | 223.356 |
| 3 | 06740011 | 0.484516 | 0.00193301 | 212.018 | 06740010 | 0.00000 | 0.486449 | 206.242 |