| Red | Green | Blue | |
| z | 17.64 | ||
| znorm | Inf | ||
| sky | -Inf | -Inf | -Inf |
| S/N | 32.0 | 51.6 | 56.3 |
| S/N(c) | 0.0 | 0.0 | 0.0 |
| SN(E/C) |
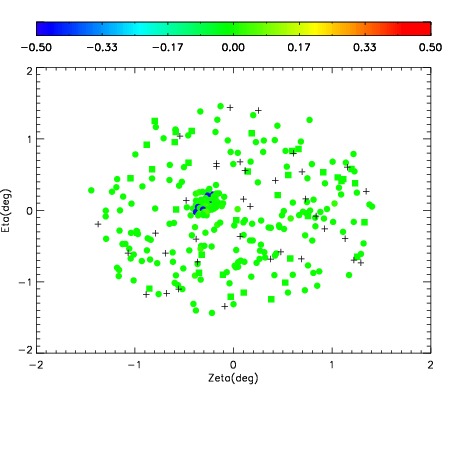
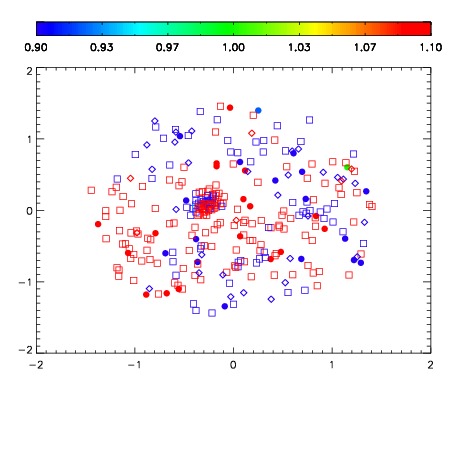


| Frame | Nreads | Zeropoints | Mag plots | Spatial mag deviation | Spatial sky 16325A emission deviations (filled: sky, open: star) | Spatial sky continuum emission | Spatial sky telluric CO2 absorption deviations (filled: H < 10) | |||||||||||||||||||||||
| 0 | 0 |
|
|
|
|
|
|
| IPAIR | NAME | SHIFT | NEWSHIFT | S/N | NAME | SHIFT | NEWSHIFT | S/N |
| 0 | 07530035 | 0.478780 | 0.00000 | 232.849 | 07530033 | 0.000960498 | 0.477820 | 232.853 |
| 1 | 07530027 | 0.471454 | 0.00732601 | 243.356 | 07530026 | 0.00000 | 0.478780 | 242.958 |
| 2 | 07530031 | 0.476086 | 0.00269401 | 239.961 | 07530030 | 0.00304833 | 0.475732 | 242.783 |
| 3 | 07530032 | 0.477646 | 0.00113401 | 238.248 | 07530029 | -0.000602872 | 0.479383 | 240.185 |
| 4 | 07530028 | 0.472538 | 0.00624201 | 234.231 | 07530034 | 0.00104122 | 0.477739 | 233.011 |