| Red | Green | Blue | |
| z | 17.64 | ||
| znorm | Inf | ||
| sky | -Inf | -Inf | -Inf |
| S/N | 28.8 | 46.2 | 49.9 |
| S/N(c) | 0.0 | 0.0 | 0.0 |
| SN(E/C) |
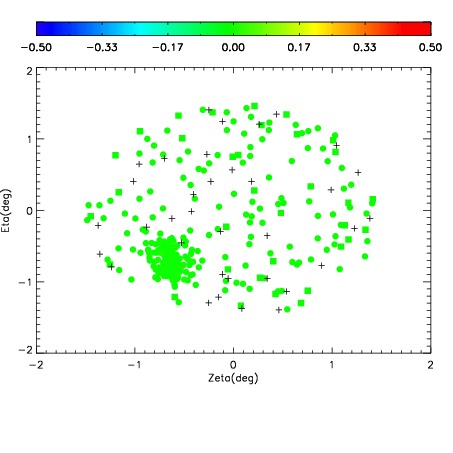
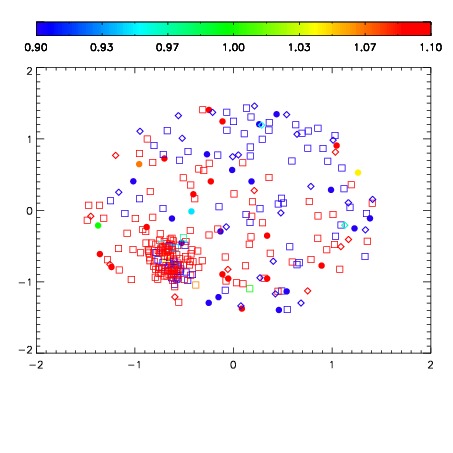
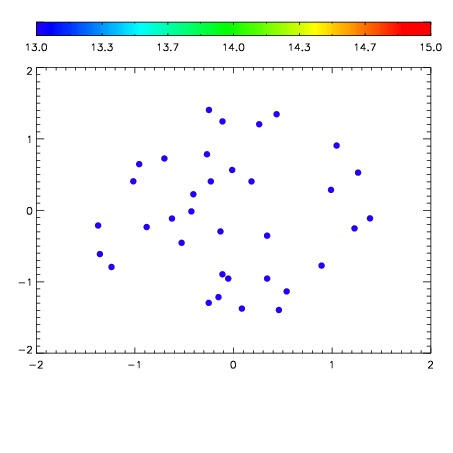

| Frame | Nreads | Zeropoints | Mag plots | Spatial mag deviation | Spatial sky 16325A emission deviations (filled: sky, open: star) | Spatial sky continuum emission | Spatial sky telluric CO2 absorption deviations (filled: H < 10) | |||||||||||||||||||||||
| 0 | 0 |
|
|
|
|
|
|
| IPAIR | NAME | SHIFT | NEWSHIFT | S/N | NAME | SHIFT | NEWSHIFT | S/N |
| 0 | 07530045 | 0.477457 | 0.00000 | 236.372 | 07530043 | 0.000821044 | 0.476636 | 234.873 |
| 1 | 07530040 | 0.474380 | 0.00307700 | 245.673 | 07530046 | 0.00278102 | 0.474676 | 241.325 |
| 2 | 07530041 | 0.474887 | 0.00256997 | 241.862 | 07530039 | 0.00000 | 0.477457 | 239.787 |
| 3 | 07530044 | 0.476042 | 0.00141498 | 239.000 | 07530042 | 0.000557088 | 0.476900 | 238.802 |