| Red | Green | Blue | |
| z | 17.64 | ||
| znorm | Inf | ||
| sky | -Inf | -Inf | -Inf |
| S/N | 23.7 | 38.9 | 40.4 |
| S/N(c) | 0.0 | 0.0 | 0.0 |
| SN(E/C) |
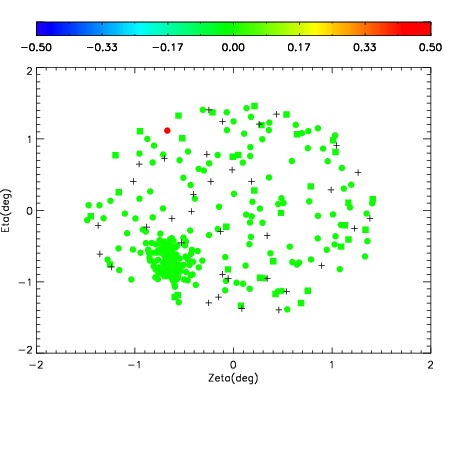
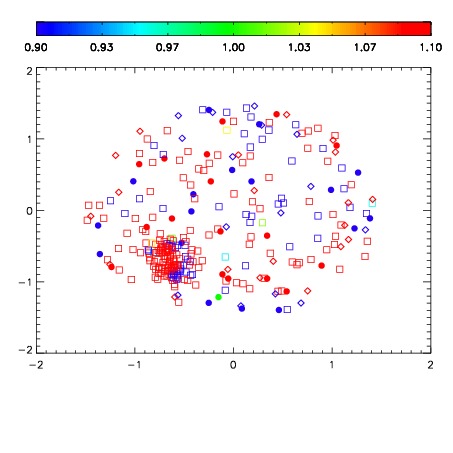
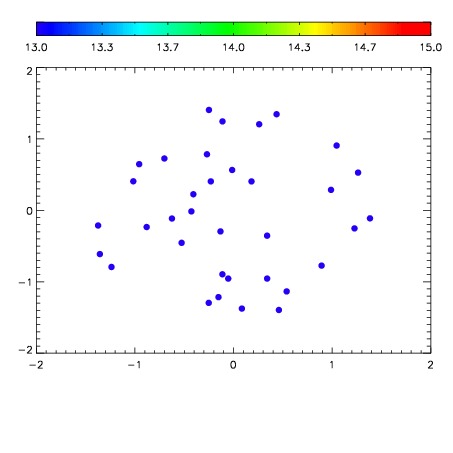

| Frame | Nreads | Zeropoints | Mag plots | Spatial mag deviation | Spatial sky 16325A emission deviations (filled: sky, open: star) | Spatial sky continuum emission | Spatial sky telluric CO2 absorption deviations (filled: H < 10) | |||||||||||||||||||||||
| 0 | 0 |
|
|
|
|
|
|
| IPAIR | NAME | SHIFT | NEWSHIFT | S/N | NAME | SHIFT | NEWSHIFT | S/N |
| 0 | 07840016 | 0.477107 | 0.00000 | 229.279 | 07840015 | 0.000187030 | 0.476920 | 234.045 |
| 1 | 07840017 | 0.476798 | 0.000308990 | 226.495 | 07840018 | 0.000401381 | 0.476706 | 232.573 |
| 2 | 07840012 | 0.475827 | 0.00127998 | 201.545 | 07840014 | -9.56864e-05 | 0.477203 | 224.888 |
| 3 | 07840013 | 0.475717 | 0.00138998 | 193.835 | 07840011 | 0.00000 | 0.477107 | 210.825 |