| Red | Green | Blue | |
| z | 17.64 | ||
| znorm | Inf | ||
| sky | -Inf | -Inf | -Inf |
| S/N | 30.3 | 53.2 | 58.4 |
| S/N(c) | 0.0 | 0.0 | 0.0 |
| SN(E/C) |
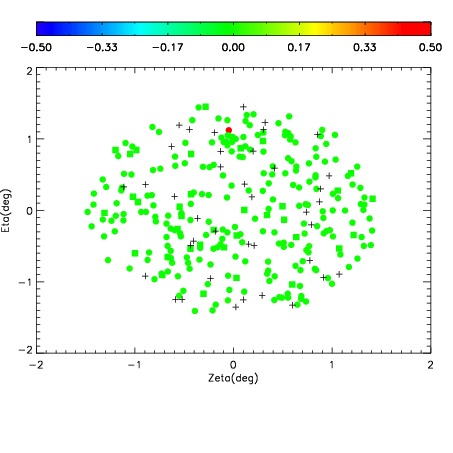
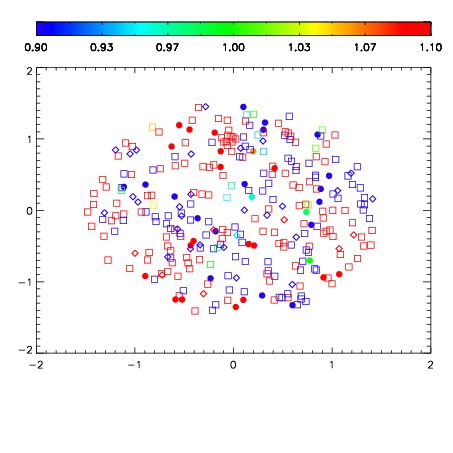
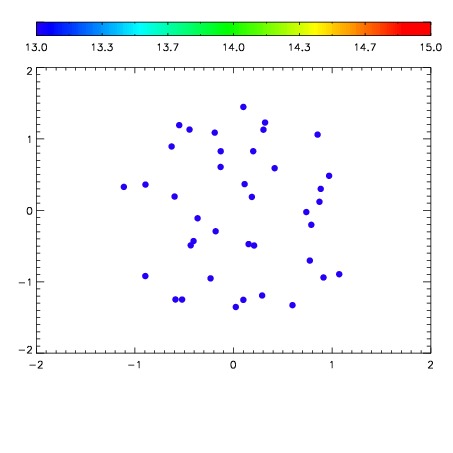

| Frame | Nreads | Zeropoints | Mag plots | Spatial mag deviation | Spatial sky 16325A emission deviations (filled: sky, open: star) | Spatial sky continuum emission | Spatial sky telluric CO2 absorption deviations (filled: H < 10) | |||||||||||||||||||||||
| 0 | 0 |
|
|
|
|
|
|
| IPAIR | NAME | SHIFT | NEWSHIFT | S/N | NAME | SHIFT | NEWSHIFT | S/N |
| 0 | 06090059 | 0.479048 | 0.00000 | 183.696 | 06090061 | -0.00317970 | 0.482228 | 193.082 |
| 1 | 06090067 | 0.474206 | 0.00484201 | 200.188 | 06090069 | -0.00925347 | 0.488301 | 200.641 |
| 2 | 06090068 | 0.474751 | 0.00429702 | 196.025 | 06090062 | -0.00566771 | 0.484716 | 197.672 |
| 3 | 06090063 | 0.475016 | 0.00403202 | 195.637 | 06090065 | -0.00751673 | 0.486565 | 196.618 |
| 4 | 06090060 | 0.478370 | 0.000678003 | 193.799 | 06090066 | -0.00903960 | 0.488088 | 195.632 |
| 5 | 06090064 | 0.476509 | 0.00253901 | 181.658 | 06090058 | 0.00000 | 0.479048 | 182.256 |