| Red | Green | Blue | |
| z | 17.64 | ||
| znorm | Inf | ||
| sky | -Inf | -Inf | -Inf |
| S/N | 30.6 | 51.6 | 54.7 |
| S/N(c) | 0.0 | 0.0 | 0.0 |
| SN(E/C) |
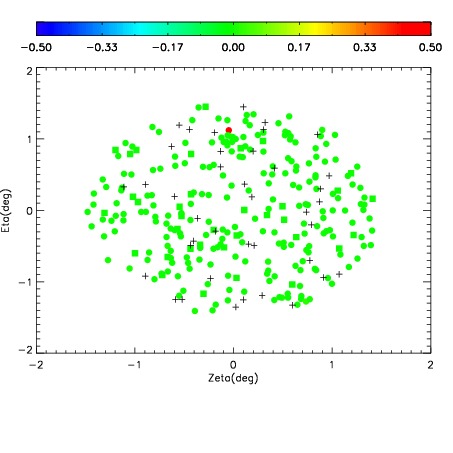
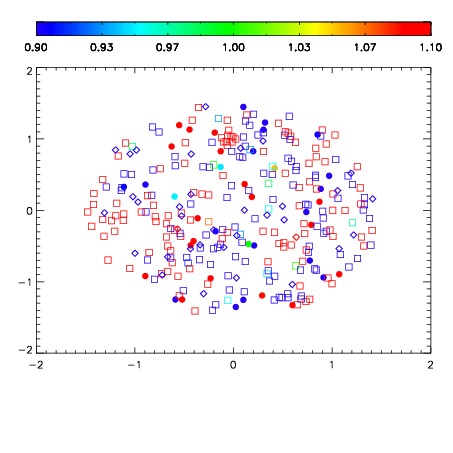


| Frame | Nreads | Zeropoints | Mag plots | Spatial mag deviation | Spatial sky 16325A emission deviations (filled: sky, open: star) | Spatial sky continuum emission | Spatial sky telluric CO2 absorption deviations (filled: H < 10) | |||||||||||||||||||||||
| 0 | 0 |
|
|
|
|
|
|
| IPAIR | NAME | SHIFT | NEWSHIFT | S/N | NAME | SHIFT | NEWSHIFT | S/N |
| 0 | 06150018 | 0.481851 | 0.00000 | 236.028 | 06150019 | 0.000863349 | 0.480988 | 229.262 |
| 1 | 06150022 | 0.479023 | 0.00282800 | 237.729 | 06150023 | -0.00481903 | 0.486670 | 237.328 |
| 2 | 06150021 | 0.473515 | 0.00833601 | 236.949 | 06150020 | -0.00415217 | 0.486003 | 233.461 |
| 3 | 06150017 | 0.477031 | 0.00482002 | 218.724 | 06150016 | 0.00000 | 0.481851 | 211.996 |