| Red | Green | Blue | |
| z | 17.64 | ||
| znorm | Inf | ||
| sky | -Inf | -Inf | -Inf |
| S/N | 23.3 | 44.6 | 47.2 |
| S/N(c) | 0.0 | 0.0 | 0.0 |
| SN(E/C) |
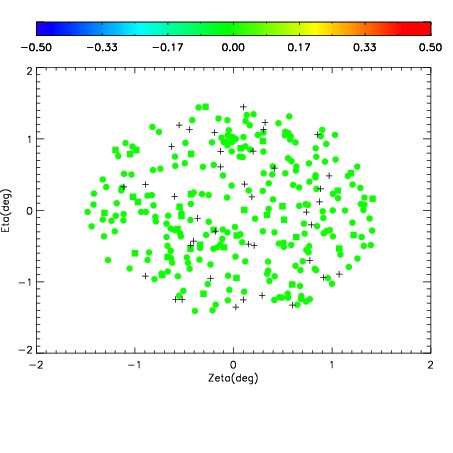
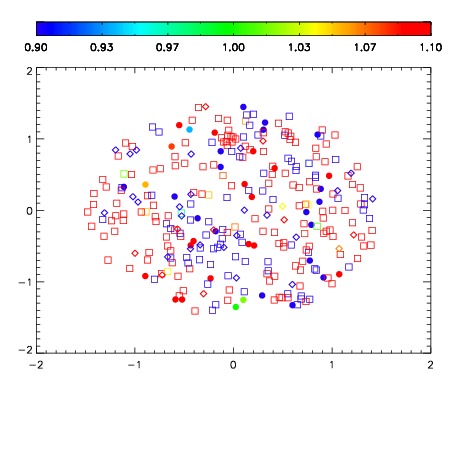


| Frame | Nreads | Zeropoints | Mag plots | Spatial mag deviation | Spatial sky 16325A emission deviations (filled: sky, open: star) | Spatial sky continuum emission | Spatial sky telluric CO2 absorption deviations (filled: H < 10) | |||||||||||||||||||||||
| 0 | 0 |
|
|
|
|
|
|
| IPAIR | NAME | SHIFT | NEWSHIFT | S/N | NAME | SHIFT | NEWSHIFT | S/N |
| 0 | 06400043 | 0.489708 | 0.00000 | 148.979 | 06400038 | 0.00000 | 0.489708 | 154.427 |
| 1 | 06400047 | 0.487512 | 0.00219601 | 177.874 | 06400046 | -0.000183534 | 0.489892 | 173.115 |
| 2 | 06400048 | 0.488589 | 0.00111902 | 175.697 | 06400049 | 0.00378263 | 0.485925 | 173.001 |
| 3 | 06400044 | 0.489598 | 0.000110000 | 158.388 | 06400045 | 0.000875589 | 0.488832 | 165.968 |
| 4 | 06400040 | 0.488930 | 0.000778019 | 158.105 | 06400042 | 0.000178534 | 0.489529 | 163.646 |
| 5 | 06400039 | 0.488554 | 0.00115401 | 156.375 | 06400041 | 0.00165897 | 0.488049 | 160.612 |