| Red | Green | Blue | |
| z | 17.64 | ||
| znorm | Inf | ||
| sky | -Inf | -NaN | -Inf |
| S/N | 33.1 | 56.8 | 59.4 |
| S/N(c) | 0.0 | 0.0 | 0.0 |
| SN(E/C) |
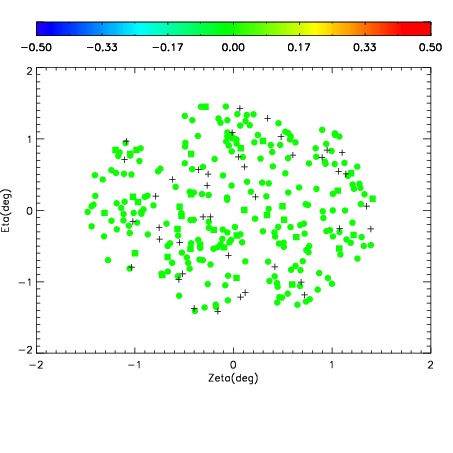
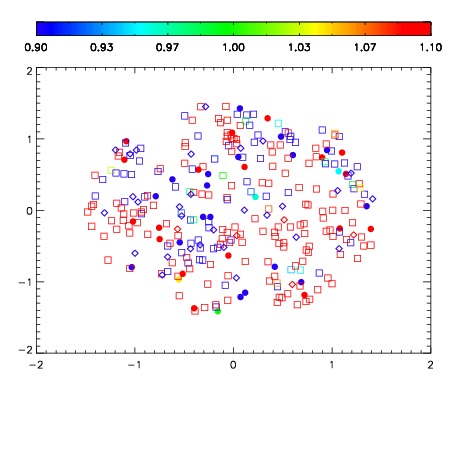
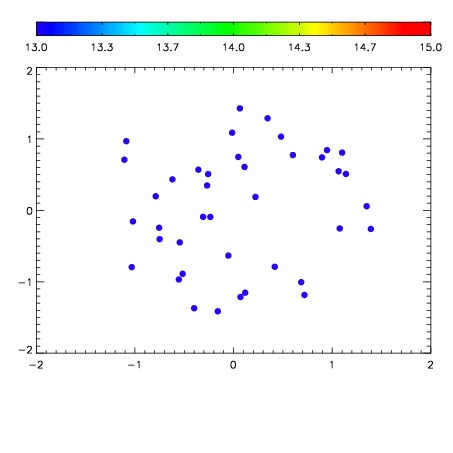

| Frame | Nreads | Zeropoints | Mag plots | Spatial mag deviation | Spatial sky 16325A emission deviations (filled: sky, open: star) | Spatial sky continuum emission | Spatial sky telluric CO2 absorption deviations (filled: H < 10) | |||||||||||||||||||||||
| 0 | 0 |
|
|
|
|
|
|
| IPAIR | NAME | SHIFT | NEWSHIFT | S/N | NAME | SHIFT | NEWSHIFT | S/N |
| 0 | 06410052 | 0.480374 | 0.00000 | 220.641 | 06410050 | 0.00231294 | 0.478061 | 214.569 |
| 1 | 06410051 | 0.479803 | 0.000571012 | 226.189 | 06410053 | -3.51218e-05 | 0.480409 | 233.557 |
| 2 | 06410043 | 0.478852 | 0.00152200 | 210.271 | 06410042 | 0.00000 | 0.480374 | 213.239 |
| 3 | 06410044 | 0.478939 | 0.00143501 | 210.071 | 06410045 | 0.00254806 | 0.477826 | 205.093 |
| 4 | 06410047 | 0.479760 | 0.000614017 | 206.716 | 06410049 | 0.00293878 | 0.477435 | 200.380 |
| 5 | 06410048 | 0.480046 | 0.000328004 | 184.814 | 06410046 | 0.00107551 | 0.479299 | 198.851 |